

Your break-even ROAS is the minimum return on ad spend needed to cover advertising and variable fulfillment costs. At that point, orders cover those costs but leave nothing for fixed overhead or profit.
For your Shopify store, a strong-looking ad report can still hide losses after product costs, delivery, and payment fees. Calculate your margin before advertising first, then set an ad target that leaves room for profit.

What break-even ROAS tells you

ROAS compares advertising-attributed revenue with ad spend. A 4x return means every ₹1 spent on ads generated ₹4 in attributed sales.
That revenue must also cover inventory, shipping and transaction fees. Your break-even threshold accounts for these costs before you decide how much advertising an order can support.
Above that threshold, an order has positive contribution after advertising. Below it, the order loses money on the costs included in your calculation.
A campaign above break-even can still leave the business unprofitable because its remaining contribution must cover fixed overhead.
Treat Shopify as your store platform, separate from marketing sources such as Google Ads, email and SEO. Otherwise, channel comparisons can be misleading.
Calculate break-even ROAS from contribution margin
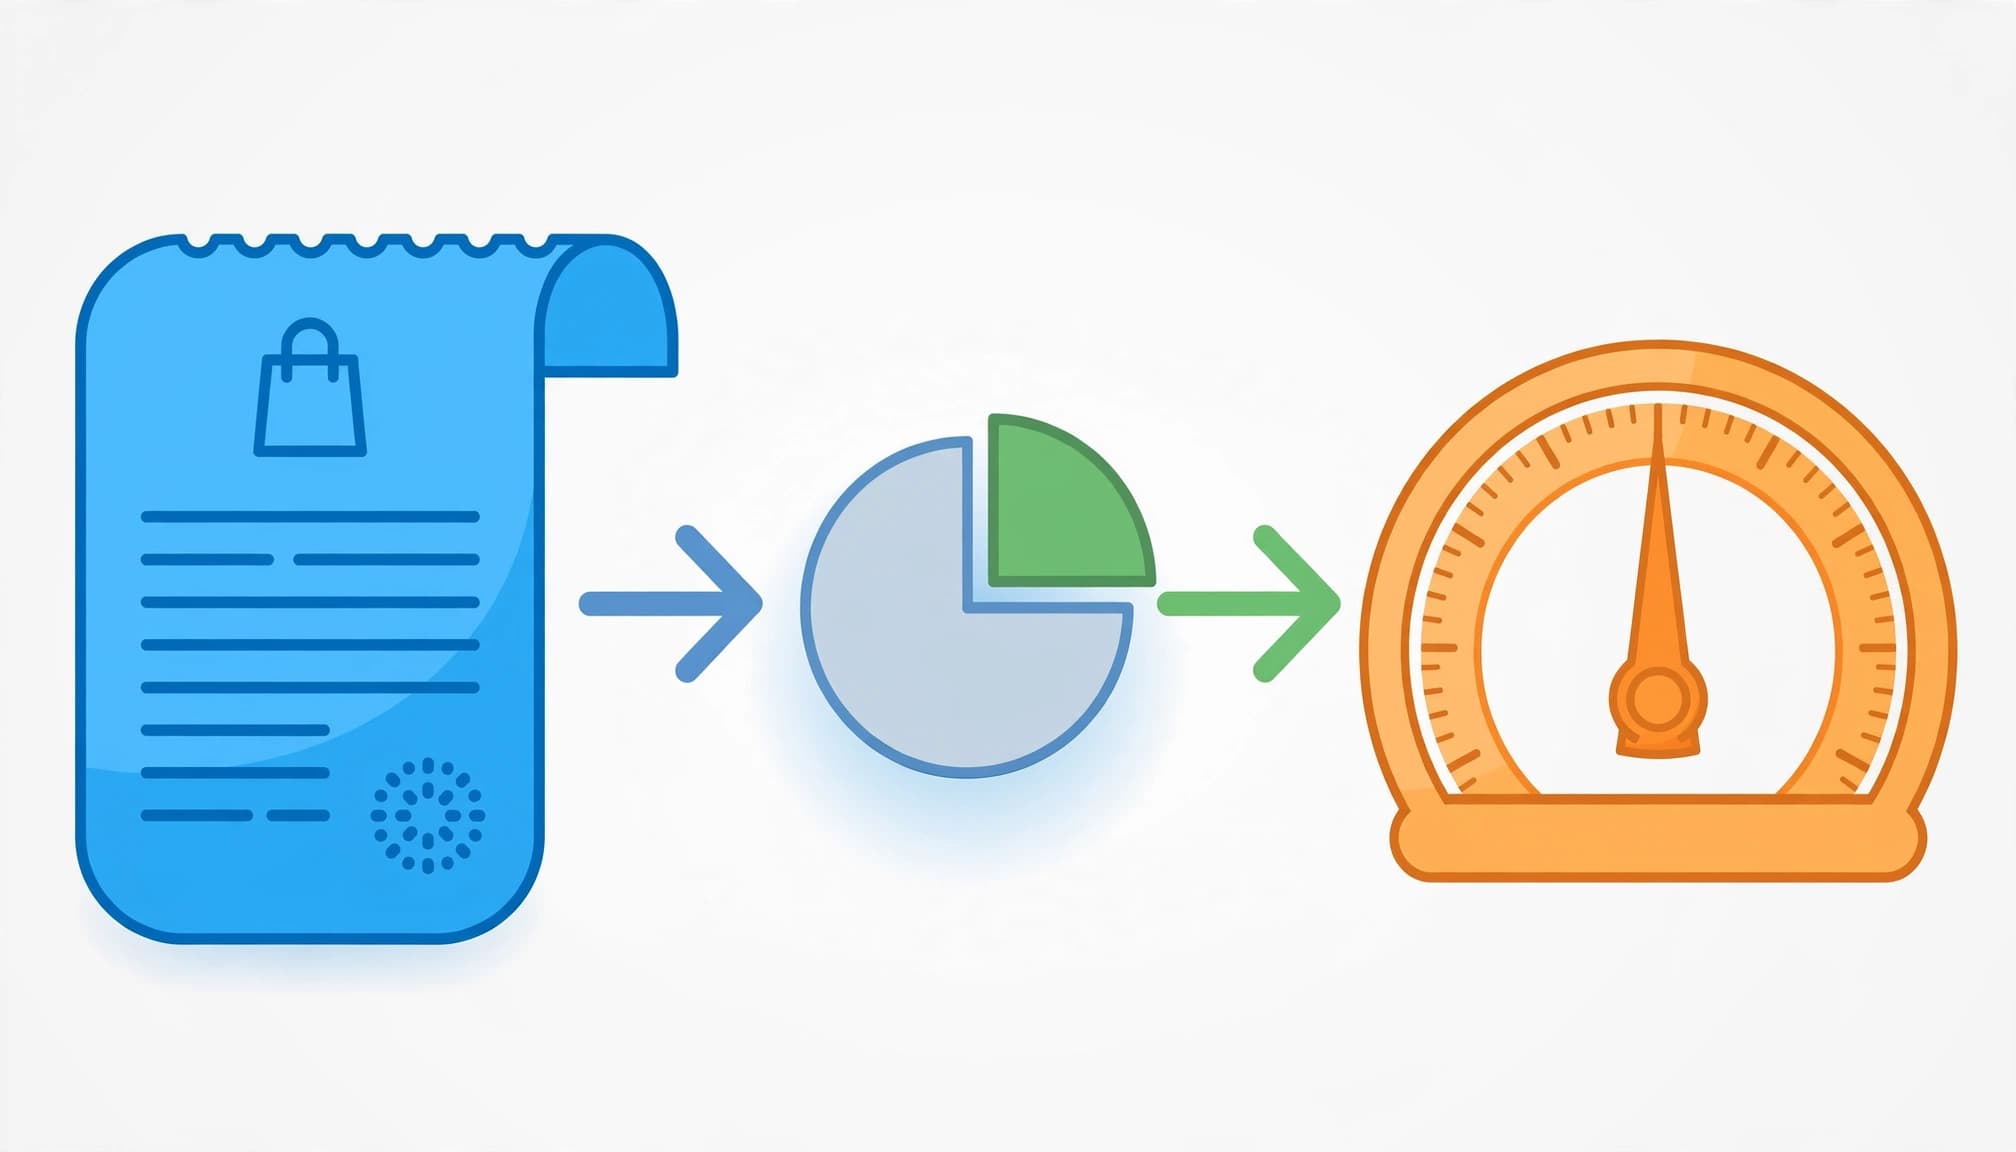
The break-even ROAS formula starts with what remains before advertising:
Contribution margin = selling price minus variable costs
Break-even ROAS = selling price / contribution margin
Divide 1 by the pre-ad margin percentage as a decimal. A 40% margin gives 1 / 0.40 = 2.5x, while 50% gives 2x.
Some calculators call this input “gross profit margin.” That version works only when it includes the same variable costs. Accounting gross margin often excludes fulfillment and payment expenses.
Thin margins quickly increase the advertising return required.
| Pre-ad margin | Break-even ROAS |
|---|---|
| 50% | 2x |
| 40% | 2.5x |
| 25% | 4x |
| 20% | 5x |
| 10% | 10x |
This explains why one universal ecommerce ROAS benchmark is unreliable.
Triple Whale expresses the same relationship through customer acquisition cost: AOV x gross margin – CAC = 0. Its $50 average order value, 50% margin and $25 acquisition cost produce BEROAS of $50 / $25 = 2x.
A Shopify example: costs, fees and discounts

Use revenue and costs from the same order or reporting period. Comparing discounted sales with full-price margins understates your target.
Start with selling price and variable costs

For a Shopify order, use a $100 product price and $60 in applicable variable costs. The $60 should include product cost/COGS, fulfillment and shipping, payment fees, and other variable per-order costs.
The order leaves $40 before advertising, so:
$100 / ($100 – $60) = 2.5x
You can spend $40 acquiring that sale before its contribution reaches zero. Spending $25 instead produces 4x ROAS and leaves $15 toward overhead and profit.
The arithmetic works identically in rupees. A ₹1,000 order with ₹600 in variable costs leaves ₹400, giving the same 2.5x threshold. Currency changes the amounts, not the ratio.
Discounts reduce your advertising allowance

A $10 discount reduces revenue from $100 to $90. If variable costs stay at $60, contribution falls to $30 and the threshold becomes $90 / $30 = 3x.
Percentage-based payment fees also change with the amount charged. Recalculate them using the actual charge rather than carrying forward an old margin.
A higher average order value (AOV) lowers the required ROAS only when the basket’s margin percentage improves. Adding low-margin products or subsidizing heavier delivery can offset the benefit of a larger basket.
Choose costs that match your decision
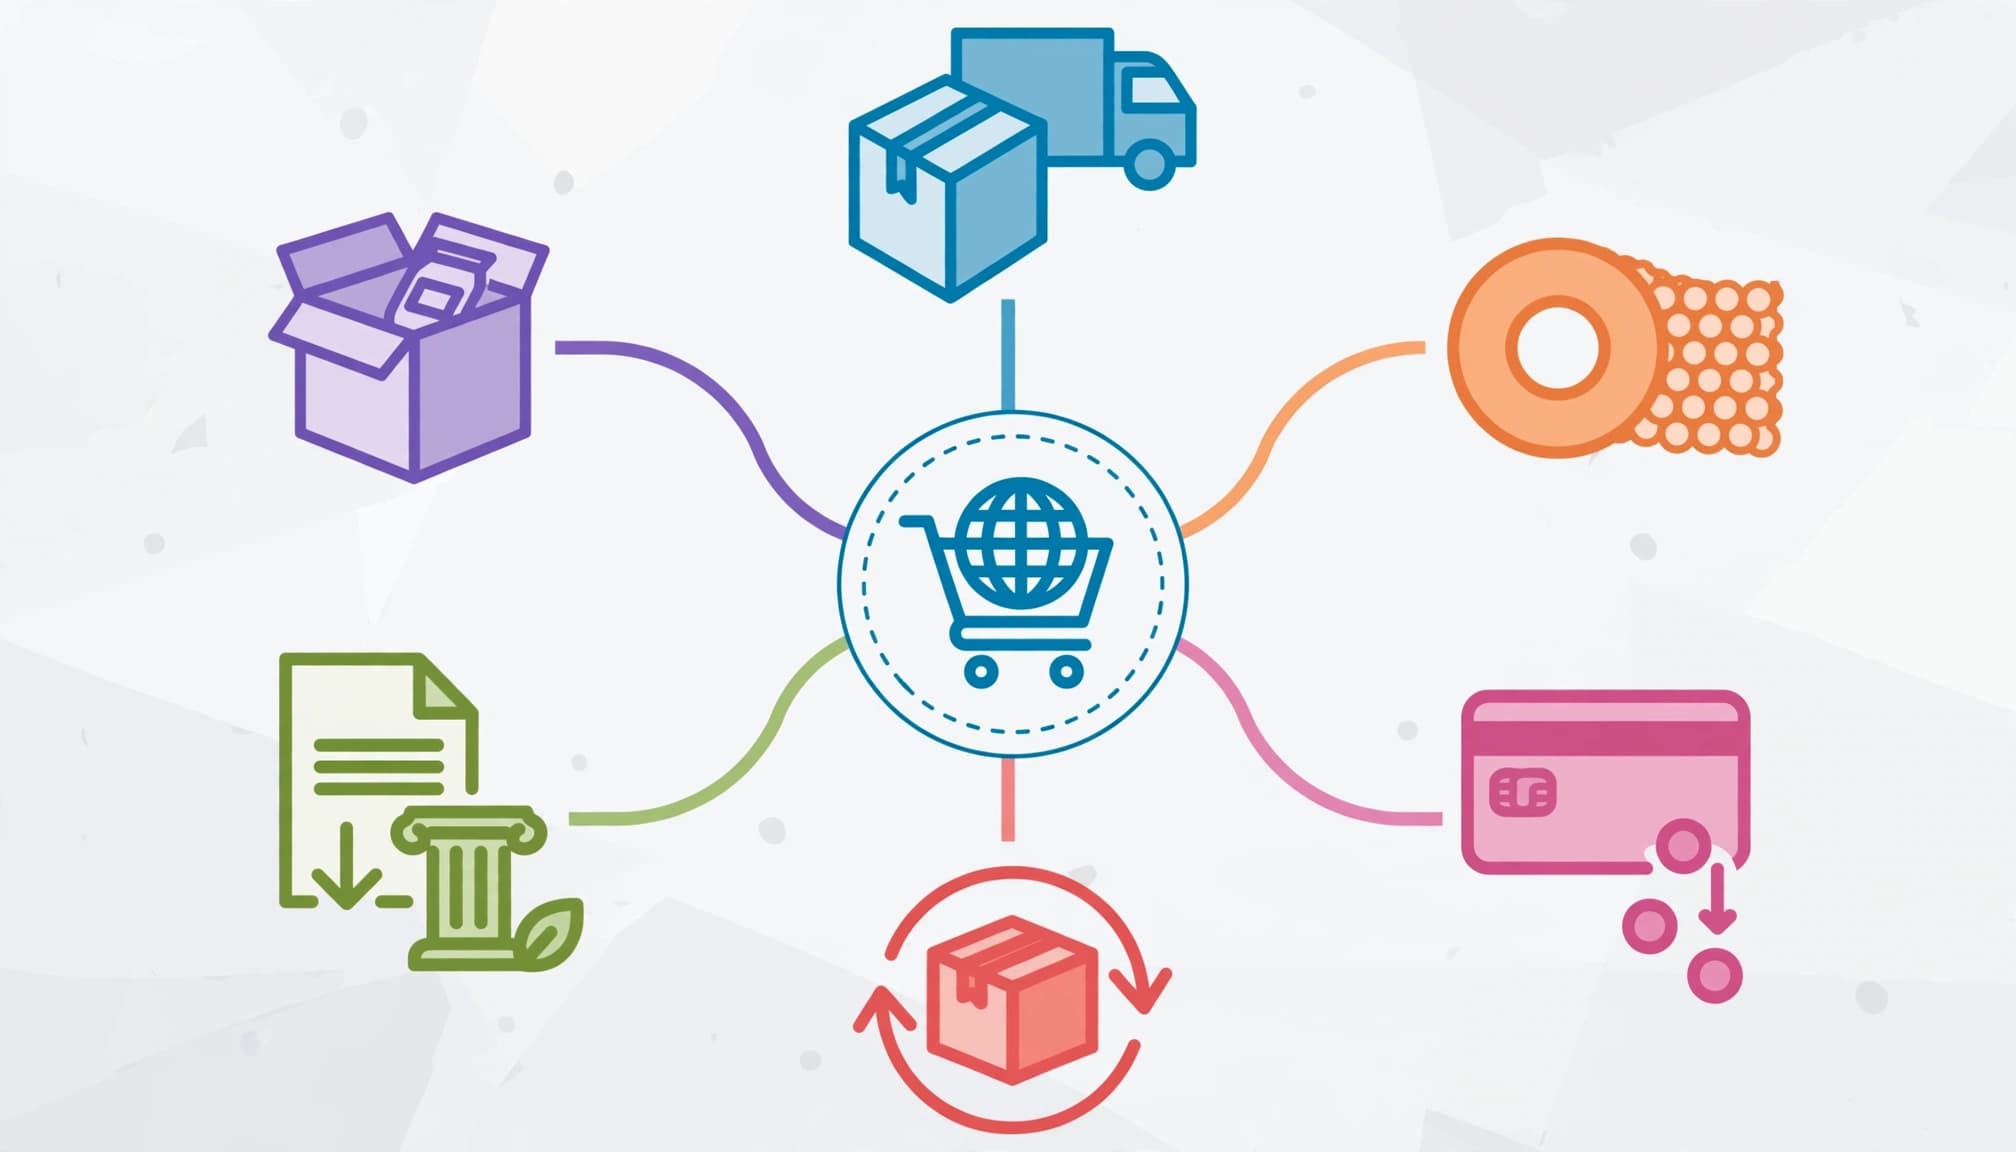
At the store level, calculate a practical floor with product cost, packaging, fulfillment, shipping costs, payment processing, applicable per-order platform charges, and expected return costs.
For Kolkata merchants offering cash on delivery, include COD charges and return-to-origin losses. Judge completed, paid orders separately from accepted checkouts.
Product-level and store-level margins answer different questions

At the product level, Bloom’s Shopify margin guide distinguishes product-level CM1 from store-level CM2, or margin after fulfillment. Its $100 product minus $30 product cost and approximately $3 in transaction fees leaves $67, producing roughly 1.5x before order-level shipping.
Bloom advises against splitting order-level shipping across individual SKUs in the product view. Include shipping in the whole-order calculation instead.
Its processor-fee estimate is around 2% to 3%, depending on plan and gateway. Use your actual charges.
Margin labels vary. In our reporting, CM1 means contribution before marketing and CM2 means contribution after attributable marketing spend. Written definitions prevent false comparisons.
Keep fixed overhead outside the order calculation

Permanent salaries, rent, fixed software subscriptions, legal costs, routine banking charges, income taxes, and interest sit outside this pre-ad contribution calculation.
They still need funding. Shopify’s business break-even calculation divides fixed costs by unit contribution margin to establish the break-even point, or sales volume required.
Therefore, positive contribution after ads is progress toward business profitability, not proof that every expense is covered.
Calculate your store’s floor step by step

Once your inputs are ready, use a spreadsheet or Shopify’s break-even ROAS calculator.
- Choose one product group or order cohort and use a consistent reporting window.
- Calculate net revenue after discounts, cancellations and refunds. Exclude sales tax collected for remittance.
- Subtract matching variable costs before advertising to find your contribution.
- Divide net revenue by contribution to calculate break-even ROAS. Compare actual ROAS using the same revenue basis.
If contribution is zero or negative before ads, no finite ad return can fix those order economics.
Reconcile Shopify orders with payment records and fulfillment costs. Then validate unique transaction IDs with our Shopify GA4 tracking guide to avoid duplicate purchase reporting.
Set a profitable ad target, then assess results
Your financial floor and operating target have different jobs. Use the floor to check whether the included order economics lose money, then set your target higher to reserve contribution for overhead and profit.
Leave room above the floor

To reserve a chosen contribution percentage after advertising:
Target ROAS = 1 / (pre-ad margin percentage – desired post-ad contribution percentage)
With a 40% pre-ad margin and a desired 15% contribution afterward, advertising can consume 25% of revenue. Your target becomes 1 / 0.25 = 4x, or 400% in Google’s target ROAS field.
A financially desirable target doesn’t guarantee delivery. An overly aggressive bidding target can restrict auctions. Establish reliable purchase values first, then introduce targets gradually.
Our Google Ads management services connect campaign decisions with revenue and commercial goals.
Compare actual returns with changing margins

Compare results using revenue and costs from the same order set, including completed orders and refunds. Below the floor, reduce exposure while fixing pricing, product costs, delivery losses or conversion performance. Above break-even but below your profit target, hold expansion until contribution improves.
When returns exceed your target, increase budgets gradually and watch contribution dollars alongside the percentage.
Recalculate when costs change. Bloom’s example shows the threshold rising from 1.52 in June to 2.56 in August while blended ROAS fell from 4.0 to 2.5, leaving the store below break-even.
Also, separate prospecting from remarketing. Blended results can hide a product losing money. Accept first-order losses only with measured repeat-purchase economics and a defined payback limit.
Key takeaways

- Calculate the floor using contribution before advertising, with consistent revenue and cost definitions.
- Set your operating target higher to reserve money for overhead and profit.
- Review contribution dollars, refunds and product mix before increasing budgets.
Frequently asked questions

How do I calculate break-even ACoS?

Amazon Ads explains ACoS as advertising cost divided by attributed sales. ROAS is the reciprocal: ROAS = 1 / decimal ACoS, while ACoS percentage = 100 / ROAS. A 4x ROAS equals 25%.
Merch Jar’s example uses a $30 product with $8 product cost, $9.50 in Amazon fees, and $1 in other costs. The $11.50 contribution margin produces approximately 2.61x break-even ROAS and 38.33% break-even ACoS, using unrounded figures.
Why isn’t platform ROAS the same as profit?

Meta, TikTok, Snapchat, and Google report attributed revenue against ad spend. Standard ROAS doesn’t subtract COGS, shipping, transaction fees, or VAT liabilities.
At 1x, attributed revenue equals ad spend, but product and delivery expenses still need to be paid.
Attribution also doesn’t prove that ads caused every reported purchase. Compare platform results with confirmed orders and completed return windows. For larger budget decisions, controlled holdouts can help separate additional sales from purchases that would have happened anyway.
Use margin to guide your next budget

Your pre-ad margin determines what you can afford to spend acquiring an order. Break-even ROAS turns that allowance into a clear advertising floor.
Set your profit target above it, then assess campaigns against completed orders and matching costs.
For help connecting Shopify tracking, margin calculations and paid campaigns, Get In Touch With Us.