


The MQL to customer rate reveals when marketing qualified leads create misleading volume comparisons because their downstream conversion rate is weak. It tracks movement through the sales funnel from initial inquiry to a closed-won customer, giving budget owners a clearer signal than lead volume alone.
For b2b companies, the real work starts after a prospect converts. A marketing team and sales team need shared lifecycle definitions, clean source data, and enough time for leads to move through the sales cycle. This improves sales and marketing alignment, making the result a commercial conversion metric for budget decisions and business growth.
What the MQL to customer rate measures
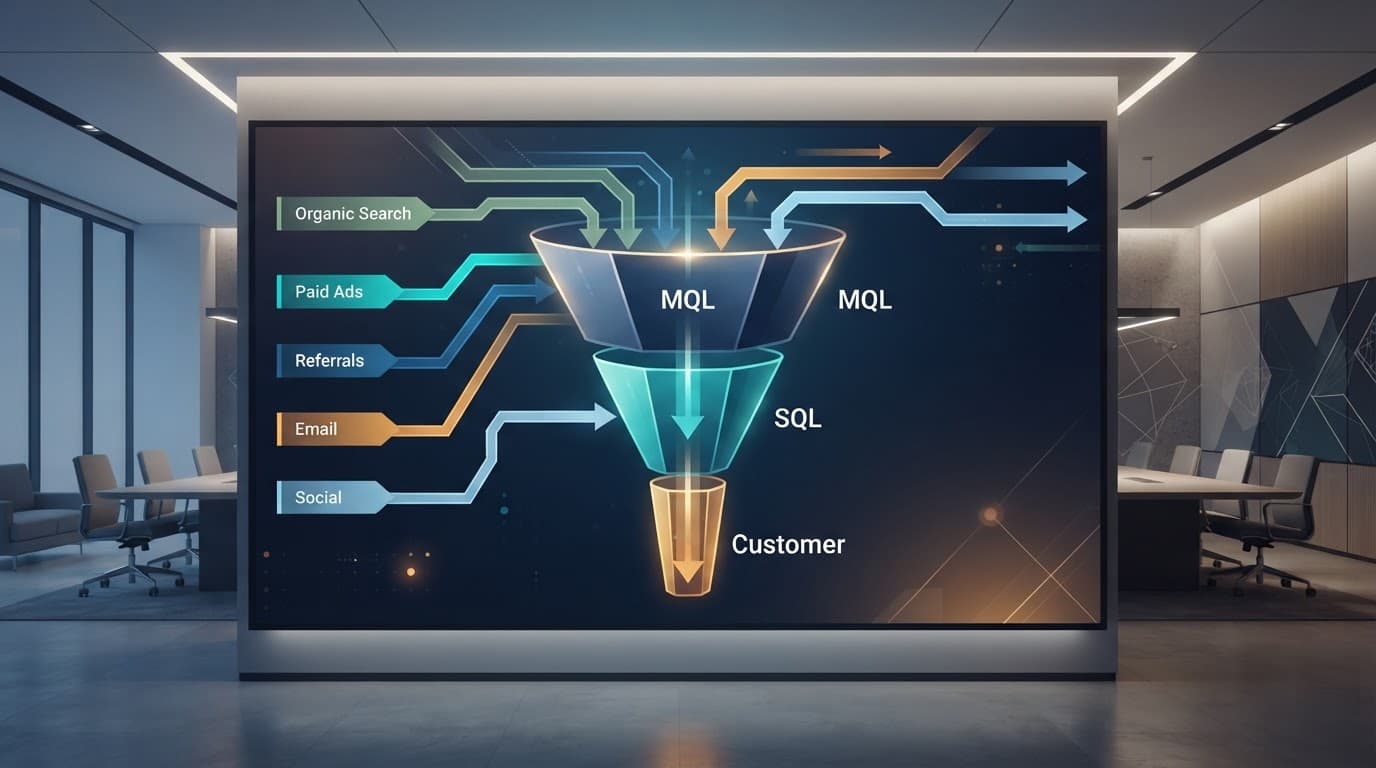
The end-to-end customer conversion rate tracks the share of marketing qualified leads that become closed-won customers. It follows the full sales funnel instead of stopping when sales accepts a lead.
This view exposes problems that top-line lead metrics hide. A paid campaign may generate plenty of MQLs but few deals. Meanwhile, SEO might bring fewer leads that convert at a higher rate and create larger opportunities.
Define each lifecycle stage before reporting
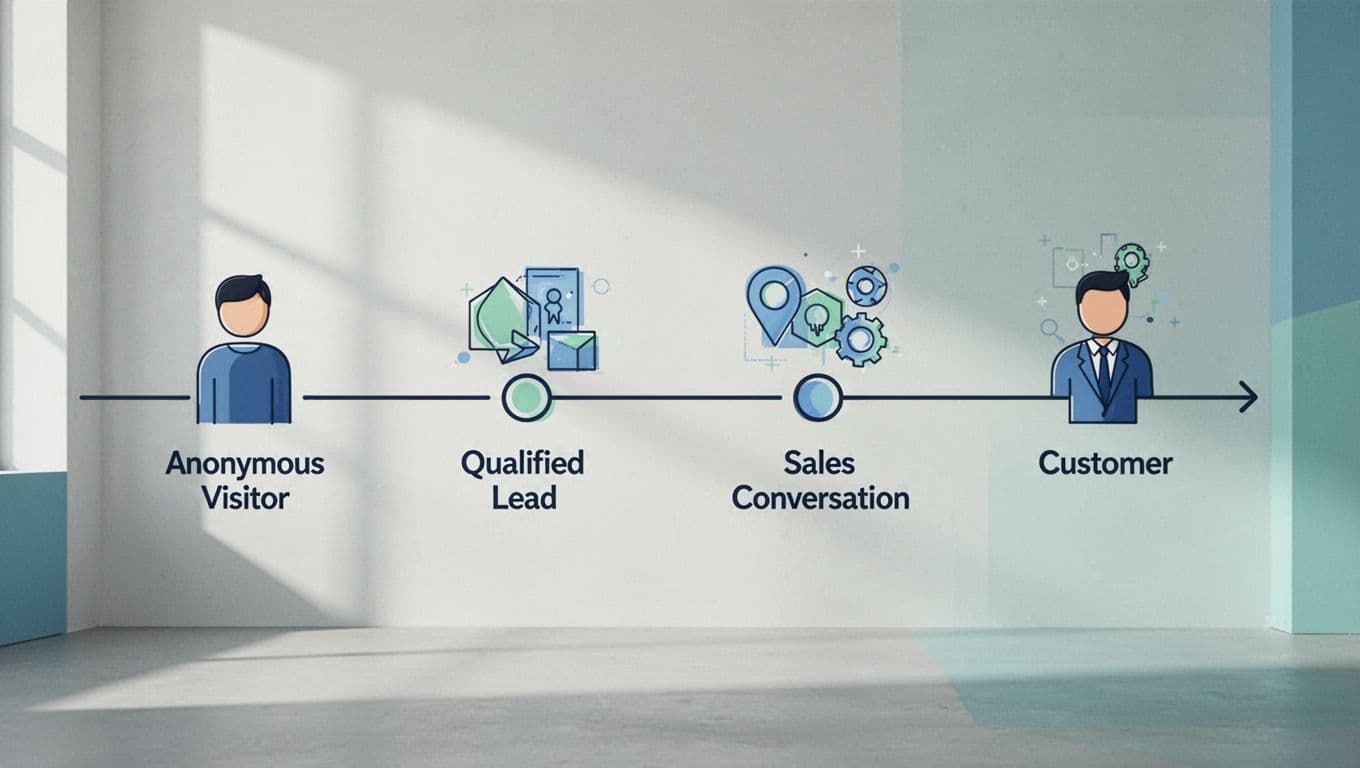
A lead has shown interest through a form, call, chat, event registration, or another tracked action. An MQL meets marketing’s agreed engagement or fit criteria, while SQLs are sales qualified leads that meet the sales team’s criteria for an active conversation.
The stages after SQL matter just as much. An opportunity has a real commercial path, while a customer has a closed-won deal. A clear lifecycle of lead, MQL, SQL, opportunity, and customer keeps reporting consistent across the buyer journey.
Lead qualification should combine fit and intent, reflecting your actual ideal customer profile and sales process. Company size, buyer role, region, use case, budget range, project scope, and service fit help assess lead quality; separate spam, duplicates, job seekers, support requests, and poor-fit enquiries.
MQL to SQL is a handoff metric, not a revenue metric

The MQL to SQL conversion rate measures the percentage of MQLs accepted or progressed by sales. It can reveal weak targeting, unclear qualification rules, or a slow sales response.
Accepted leads can still stall before an opportunity or lose during procurement. The end-to-end customer outcome measures closed-won customers from the same MQL cohort, so neither metric is interchangeable with the other.
Low acquisition cost doesn’t compensate for low-quality leads or weak downstream revenue, so a channel shouldn’t receive a larger budget for cheap MQLs that rarely become closed-won customers.
Calculate the MQL to customer rate by cohort

Use a defined MQL cohort, channel, attribution model, and observation window. For example, group all MQLs created in Q1 through organic search. Set the observation window long enough to cover the normal sales cycle length.
| Metric | Formula | What it shows |
|---|---|---|
| MQL to SQL conversion rate | SQLs from the defined MQL cohort / total MQLs in that same cohort x 100 | Sales acceptance and qualification quality |
| MQL to customer rate | Unique closed-won customers from the defined MQL cohort / total MQLs in that same cohort x 100 | End-to-end customer conversion |
| Customer acquisition rate | Customers acquired during a defined time period, such as customers per month or quarter | Operational volume, not an MQL conversion formula. Document any different denominator explicitly |
| Customer acquisition cost | Total channel cost / new customers attributed to that channel | Cost metric, not a conversion rate |
| Revenue per MQL | Closed-won revenue from the cohort / MQLs in the cohort | Revenue quality of the lead source |
For a valid comparison, use the same cohort window, maturity rule, and attribution model for every channel. Organic search had 200 MQLs, 60 SQLs, 12 customers, and $24,000 in spend. Paid search had 400 MQLs, 80 SQLs, 8 customers, and $32,000 in spend.
| Channel | MQLs | SQLs | Customers | Spend | MQL-to-SQL rate | MQL-to-customer rate | CAC |
|---|---|---|---|---|---|---|---|
| Organic search | 200 | 60 | 12 | $24,000 | 30% | 6% | $2,000 |
| Paid search | 400 | 80 | 8 | $32,000 | 20% | 2% | $4,000 |
Organic search’s MQL to SQL conversion rate is 30%, based on 60 SQLs from 200 MQLs. Its MQL-to-customer rate is 6%, based on 12 customers from 200 MQLs. Paid search reaches 20% from 80 SQLs out of 400 MQLs, and 2% from 8 customers. The channels produced 12 versus 8 customers per quarter as operational volume, rather than as another MQL percentage. This indicates stronger downstream conversion efficiency for organic search.
Pair the rates with MQL volume, sales opportunities, sales pipeline value, closed revenue, average deal size, and sales-cycle length. Keep customer volume separate from other conversion rate metrics. A small referral source may convert exceptionally well but lack the scale required for quarterly targets.
Percentages from small cohorts can be unstable. Show the underlying counts beside every rate, and don’t declare a channel winner from a handful of customers. Use confidence intervals or additional mature cohorts when sample sizes are small.
There are no universal industry benchmarks. Deal size, qualification rules, sales coverage, attribution, and sales cycle length all change the outcome. Compare each channel against sufficiently mature internal cohorts and historical data, then explain meaningful movement rather than making unsupported benchmark claims.
Why acquisition channels produce different outcomes

Search, paid media, partner referrals, events, email, and social campaigns reach buyers with different levels of intent. These differences affect lead quality and conversion rates. Teams shouldn’t judge channels by lead volume alone.
SEO often captures active research. Performance marketing can capture immediate demand, although broad targeting may add weak submissions. Social Media Marketing may create awareness and retarget prospects before they’re ready to speak with sales. Website Development also matters because a revised form or landing page can change the conversion rate, submission volume, and downstream conversation quality.
Keep channel, source, campaign, and landing-page data separate

Keep channel, source, campaign, landing page, and touchpoint as separate dimensions in the CRM. Store immutable fields for original lead source, original campaign, first landing page, and first conversion date. Record later visits and campaign interactions as additional touchpoints rather than overwriting the original source.
A source might be Google Ads, LinkedIn, a partner, or organic Google. A channel is the larger category, such as paid search, paid social, referral, or organic search. Consistent naming keeps lead generation reporting reliable and prevents free-text entries from breaking it.
GA4 custom channel groups can keep SEO, GEO, AEO, paid search, and paid social distinct in a reporting view. Use documented naming rules for each group. This distinction is useful when search discovery and answer-engine visibility contribute early awareness, but a later paid interaction captures the form submission. Historical data is useful only when tracking definitions and the attribution model remain comparable.
Judge channel cohorts only after they mature

A lead created this month may close next month or much later. Comparing a fresh enterprise cohort with an older small-business cohort can make a channel look worse than it is.
Set a maturity rule based on each offer’s sales cycle length. Then segment results by service line, region, company size, buyer type, campaign, and landing page when volume allows. Blended reporting can hide a high-value enterprise segment behind many smaller, faster enquiries.
Teams must choose one attribution model and apply it consistently across channels, cohorts, and reporting windows. Don’t compare first-touch organic results with last-touch paid results and then call the difference a channel effect.
First-touch attribution identifies who introduced the prospect. Last-touch identifies the interaction nearest conversion. Multi-touch or data-driven models distribute credit differently across the journey.
Direct traffic, dark social, offline events, retargeting, branded search, and CRM or source overwrites can create attribution gaps. Reported channel performance is therefore directional, not perfectly causal. Teams can use Marketing attribution methods to understand these approaches and choose a consistent framework.
Build a measurement system sales teams trust

A clean data-flow diagram connects GA4, the CRM, advertising platforms, sales operations, and the reporting dashboard.
GA4 records website behavior and lead generation events; the CRM records deduplicated people, lifecycle stages, opportunities, closed-won revenue, and costs. The sales team maintains CRM stages and revenue data; the marketing team manages analytics events, campaign details, and the lead source from the first conversion. Connect them through a stable lead ID and disciplined data hygiene to support sales and marketing alignment.
Track confirmed generate_lead or form_submit events, not clicks on a submit button. Deduplicate people before calculating totals, retain a spam flag for poor submissions, and investigate discrepancies instead of silently deleting data. Data loss can inflate or distort conversion rates. A GA4 lead tracking checklist helps validate that website events fire only after a genuine conversion.
Each month, compare confirmed generate_lead or form_submit events with unique CRM records. The GA4 and CRM reconciliation guide is useful when form totals, MQLs, and SQLs don’t line up. Inspect duplicate and spam rates, verify source-field completeness, and reconcile MQLs, SQLs, sales opportunities, customers, and revenue. Review overdue leads, response time, and loss reasons alongside those results.
A shared dashboard should show spend, MQLs, SQLs, cost per SQL, opportunities, sales pipeline value, customers, closed-won revenue, sales cycle length where available, and channel-level customer acquisition cost. A Looker Studio lead generation dashboard provides a practical structure for connecting these KPIs.
Improve channels with weak downstream conversion

Weak downstream conversion can reflect poor-fit lead generation, an overly broad offer, or a low MQL threshold. Slow response, pricing friction, or a broken sales process can also contribute. Locate the exact stage where conversion rates decline before changing the entire channel.
Tighten scoring and the sales handoff

Use lead scoring to combine fit and intent. Fit includes company profile, geography, role, and likely budget. Intent can include high-value page visits, demo requests, webinar attendance, repeat sessions, or responses to commercial offers.
Then define lead qualification criteria in an SLA. State who owns the lead, the first-response time, and why sales can reject it. Use controlled reasons such as “out of market,” “no budget,” “existing customer,” or “not a decision-maker.” Capture feedback from the sales team to improve lead quality, but don’t assume a higher score automatically creates customers.
Match nurture to the buying stage
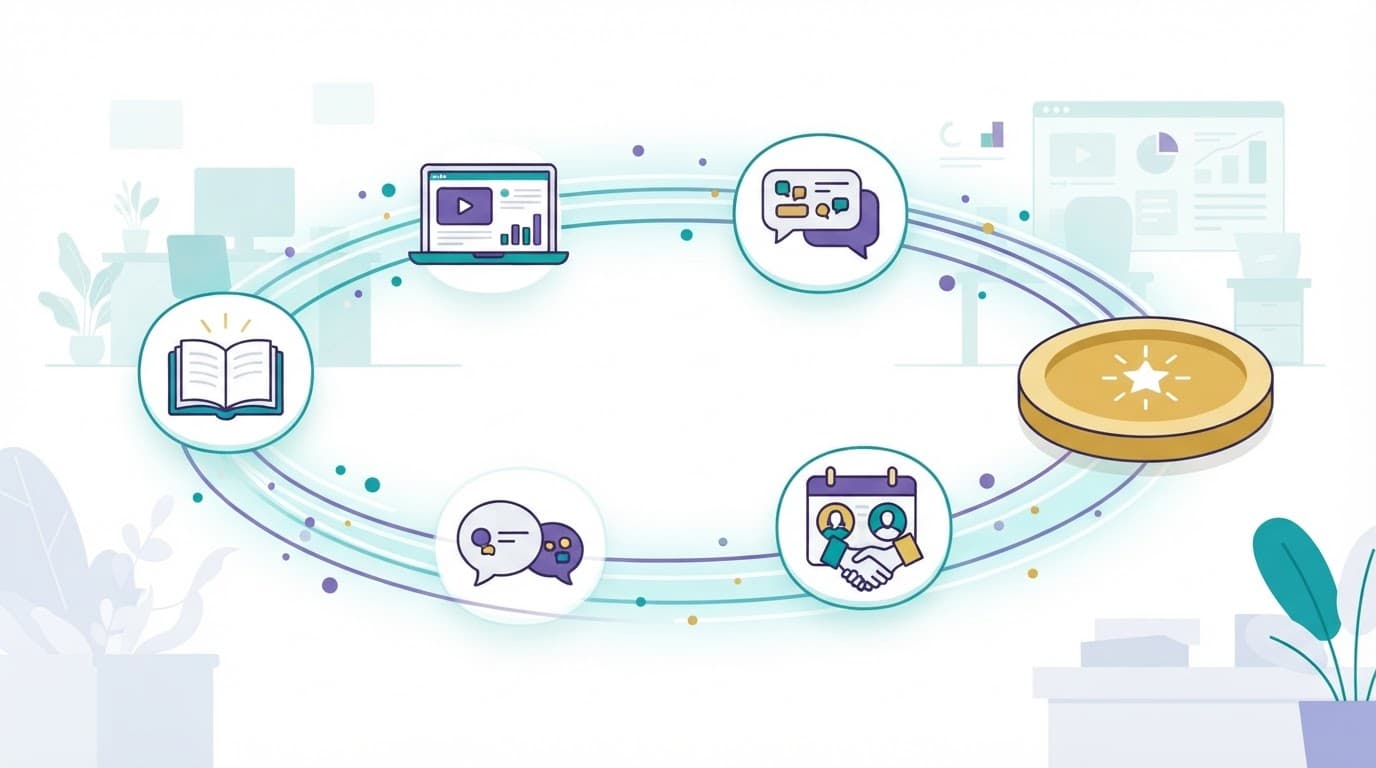
Lead nurturing should reflect the buyer’s stage, buyer type, service line, and original offer. Someone researching a problem needs different follow-up from someone comparing vendors. Useful material can include case studies, implementation details, pricing guidance, product comparisons, and a relevant consultation path.
Send accepted MQL, opportunity, and closed-won outcomes back to advertising platforms when possible. This gives automated bidding systems better evidence than raw form fills. It can support marketing strategies and conversion efficiency, but it doesn’t remove attribution limits or guarantee results. Strong Digital Marketing reporting connects those outcomes across SEO, paid campaigns, social, and onsite conversion paths.
Key takeaways
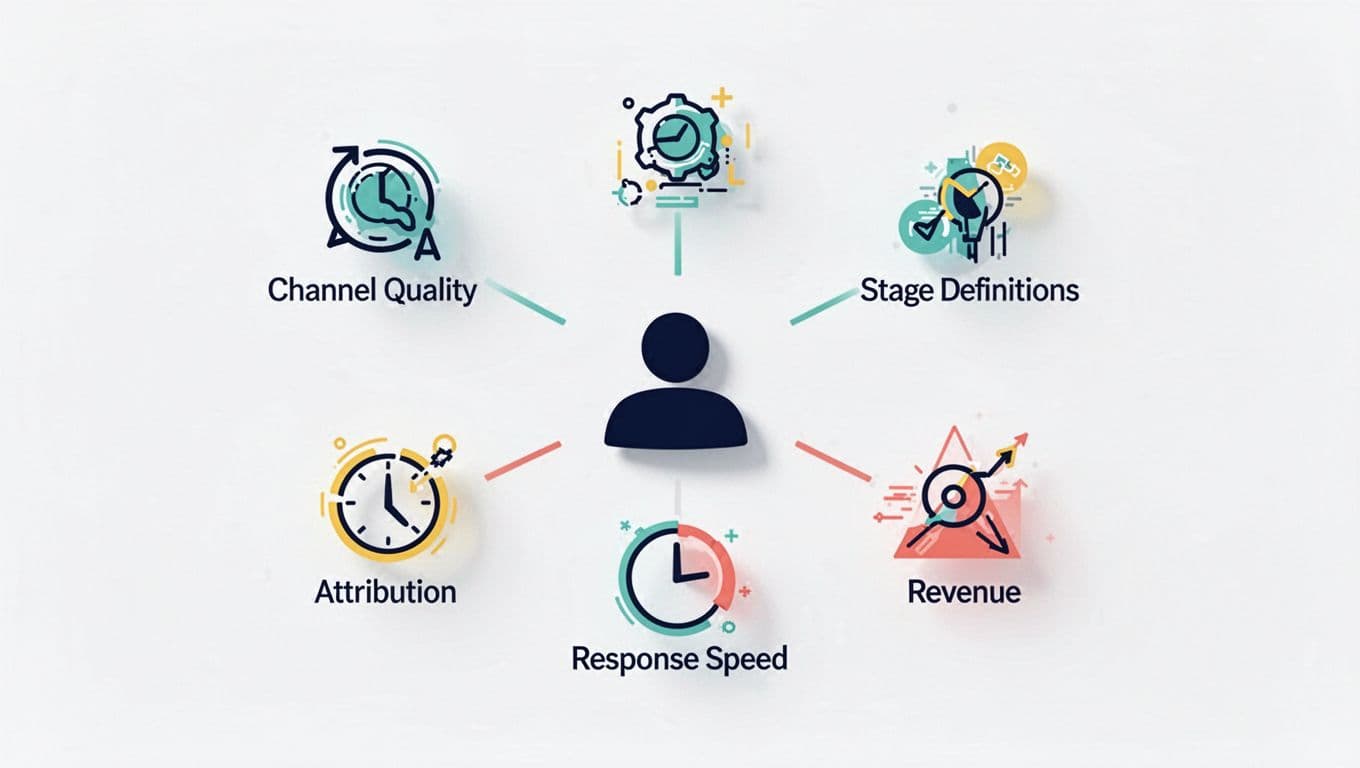
- Treat MQL-to-SQL and closed-won customer outcomes as separate parts of the conversion metric. Sales acceptance doesn’t confirm a closed deal.
- Preserve first-touch source data, then record later interactions, campaigns, and landing pages as separate touchpoints.
- Compare mature cohorts by channel, service line, location, buyer type, and deal size when volume supports it.
- Connect CRM outcomes to channel decisions, including opportunities, revenue, loss reasons, response time, and customer acquisition cost.
- Feed meaningful qualification data into campaign decisions instead of optimizing only for cheap leads.
Frequently asked questions

Alt text: AI-generated illustration of question-and-answer cards surrounding a marketing funnel.
What does the MQL to SQL conversion rate formula measure? Divide the SQLs from a defined MQL cohort by the total MQLs in that cohort. Multiply by 100. This conversion rate shows how many MQLs reached the SQL stage. Keep the channel and cohort period consistent.
How does MQL-to-customer conversion differ from the MQL-to-SQL formula? The first divides closed-won customers by cohort MQLs. The second counts SQLs instead. Use the same cohort, channel, and definitions for both measures.
What does customer acquisition rate mean? It usually means the share of prospects or leads that become customers during a defined period. It differs from funnel conversion rate because it measures customer outcomes, not movement between stages.
How should teams compare acquisition channels? Apply the same attribution model, stage definitions, cohort periods, and reporting window. Report cohort counts alongside percentages. Compare mature cohorts using consistent definitions.
Why can small cohorts or immature sales cycles make results unreliable? Small cohorts can produce unstable percentages, while an unfinished sales cycle leaves future customers uncounted. Sales cycle length, market differences, and changing definitions also make universal industry benchmarks unreliable. Wait for cohorts to mature before making channel decisions.
What causes a low MQL-to-customer conversion? Common causes include weak lead fit, misleading offers, poor source data, a low scoring threshold, slow follow-up, weak discovery calls, and an immature cohort.
Which is more useful, cost per lead or cost per qualified lead? Cost per qualified lead is more informative because it filters out low-fit enquiries. Still, channel-level customer acquisition cost and closed-won revenue are the final commercial measures.
How often should teams review channel performance? Review response-time issues and lead flow weekly. Use a monthly cohort review for channel decisions, then add quarterly views for long sales cycles and high-value deals.
Measure customers, not just conversions

The strongest acquisition channel produces profitable customers at a repeatable cost, not merely the cheapest submission or highest conversion rate. The end-to-end customer conversion metric gives teams a shared view of the closed-won outcome and supports repeatable acquisition economics.
Reliable decisions require consistent source data, clear lifecycle definitions, attribution rules, mature cohorts, and CRM revenue outcomes. To connect channel data with CRM outcomes, Get In Touch With Us to establish a practical measurement process for more confident budget allocation decisions.