
Google Ads Data Exclusions for Service Business Leads

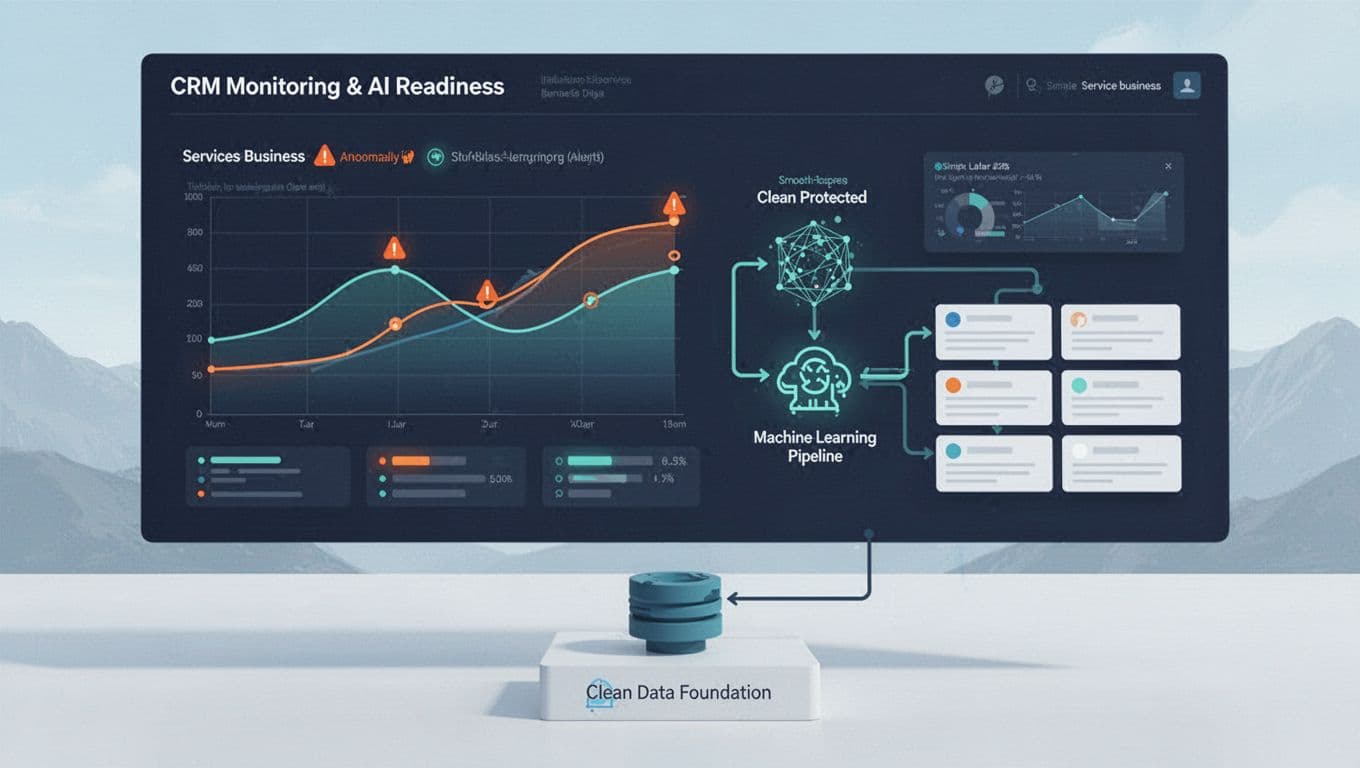
A glowing funnel links website and phone leads to an ad control with one broken connection.

A confirmed conversion data outage can follow a broken form, failed import, or tracking interruption. It may create short-term performance fluctuations. It can also weaken bidding performance when conversion tracking makes profitable clicks look worthless to Smart Bidding.

For service businesses, this matters because one missing phone lead or booked consultation can affect more than a dashboard. It can distort cost-per-lead reporting, automated bids, and budget decisions. Start with a confirmed issue, then apply data exclusions with a documented date range.

Key Takeaways

  • Use Google Ads data exclusions for confirmed conversion tracking failures, such as broken forms, failed CRM imports, or interrupted tags—not for ordinary performance fluctuations.
  • Data exclusions change the conversion data Smart Bidding uses for bid decisions, but they do not erase conversions from standard Google Ads reports or restore missing leads.
  • Set the exclusion dates around the affected click period and account for the account’s time zone and normal conversion delay.
  • Keep the campaign scope as narrow as the outage allows, then give Smart Bidding time to stabilize before changing target CPA or target ROAS.
  • Document the outage, affected conversion actions, evidence, date-range logic, campaign coverage, and fix confirmation in a shared incident record.

How Google Ads data exclusions protect Smart Bidding

Smart Bidding uses past conversion data to decide which auctions deserve higher bids. When conversion tracking breaks, valid ad clicks may appear to produce zero leads. A Google tag may stop firing, a CRM import may pause, or a booking form may fail.

Data exclusions tell the system to disregard conversion data connected to clicks during a defined affected period. Google’s data exclusion guidance describes bidding data exclusions as an advanced bid control for reducing the bidding impact of conversion-data problems.

A marketing manager reviews a laptop dashboard beside a phone and performance charts.

The control changes bidding inputs, not historic reports

An exclusion doesn’t erase conversions from your conversion reporting. It changes which conversion value data the bidding system considers when it adjusts bids. Google’s reporting clarification confirms that excluded conversions can still appear in standard reports.

That separation matters for service companies. Your finance, sales, and operations teams still need a complete record of enquiries and booked work. The exclusion protects automated bidding while preserving the reporting trail.

A data exclusion protects the bidding model. It does not restore missing leads or repair the tracking setup.

Lead-generation campaigns can feel the damage later

A service lead often takes time to become a meaningful conversion, creating a conversion delay. Someone may click an ad, call two days later, then book an appointment after a sales follow-up. Other businesses import qualified opportunities or closed deals from a CRM.

As a result, delayed or faulty signals can hurt bidding performance after the technical issue ends. They can also cause performance fluctuations in target CPA and target ROAS bidding.

These exclusions can apply to supported Smart Bidding campaigns across several advertising channel types. They include search campaigns, Display, Shopping, and Performance Max campaigns. The campaign scope doesn’t include Hotel or Travel campaigns.

When a conversion outage warrants an exclusion

Use data exclusions for confirmed conversion tracking issues, not for every bad week. A sudden fall in tracked leads can reflect lower demand, a weaker offer, changed targeting, or poor sales follow-up, not just a technical problem.

Review conversion rate against historical averages for search campaigns before assuming a measurement problem. This distinction separates tracking failures from normal performance fluctuations.

What happenedUse an exclusion?First check
A form event or Google tag stopped firingUsually yesTest the form and confirm the missing event
The website was unavailableUsually yesReview uptime records and affected tracking
Offline CRM imports failedUsually yesCompare CRM records with offline conversion data
Leads fell while tracking still worksUsually noReview search terms, landing pages, pricing, and lead handling

Confirm the source of the discrepancy first

Compare conversion tracking in Google Ads with GA4 events, call-tracking records, form submissions, booked meetings, and CRM timestamps. These sources won’t match perfectly, yet a sudden break across several sources gives you stronger evidence.

Run one consented test lead through the full path and use conversion tracking to verify it. Confirm the form submission, thank-you event, CRM record, Google Ads conversion, and any offline import. If enhanced lead data is part of your setup, use this guide to troubleshoot enhanced conversions in Google Ads before changing bid controls.

Document the start time, end time, affected conversion action, campaign scope, and proof of the failure. That record helps when several people share campaign responsibility.

Don’t use exclusions to hide a real sales problem

Data exclusions won’t fix poor lead quality, weak offers, or slow sales follow-up. They also won’t improve response times, sales scripts, or a landing page that no longer matches local demand.

A large pipeline can create false confidence when proposals have stalled. Track opportunity age, stage age, and the date of the last meaningful customer interaction separately. If quoted work sits untouched for weeks, the problem belongs in sales operations, not Smart Bidding.

Set up exclusions in the Google Ads interface

The current Google Ads path is Tools, then Adjustments, then the Exclusions tab. This workflow is an advanced bid control for Smart Bidding, and the plus button lets you add data exclusions.

Monitor showing campaign controls, a blocked date range, and a conversion tracking chart.

Follow this sequence after you have evidence of the outage and are ready to create data exclusions:

  1. Record the exact outage period in the Google Ads account’s time zone, and identify the affected conversion tracking path.
  2. Open Tools > Adjustments > Exclusions, then select the plus button.
  3. Name the exclusion clearly, such as “CRM import outage, July 2026.”
  4. Choose the account or campaign level for your campaign scope. Verify that the failing Google tag is associated with the selected conversion action. Use campaign-level selection for affected search campaigns or Performance Max campaigns. Use an account-wide scope only when the same faulty conversion process affected all relevant campaigns.
  5. Select device types only if the issue was limited to a known device group.
  6. Set a start and end date that account for your normal conversion delay, then save the exclusion.

A video walkthrough of the setup screen can help if your account layout looks different from current documentation.

Keep the campaign scope narrow when the issue was isolated. For example, exclude only campaigns using a broken booking-form conversion path, rather than every campaign in the account.

Choose dates around conversion delay

These exclusions apply to clicks that may have generated the conversion, not just the day someone noticed a reporting gap. That distinction prevents a common setup error and keeps data exclusions tied to the relevant click date.

Work backward from the click date

Suppose your CRM shows that most booked consultations occur several days after an ad click. If conversion tracking fails today, some missing conversions may belong to earlier clicks.

This conversion delay can link missing conversions to earlier clicks. A range based only on discovery can leave bad training data in the Smart Bidding model.

Review actual click-to-lead timing where possible. For search campaigns, use CRM records and click IDs to identify the normal lag. A practical target is to cover at least 90% of that pattern when the data is reliable.

Use evidence to keep the range sensible

A long exclusion range can remove useful learning data during normal performance fluctuations. Therefore, extend dates only as far as outage evidence and observed lag support. Use data exclusions for an outage, rather than seasonality adjustments for ordinary demand changes.

Match the dates to the account time zone. Also, separate a broken tag from delayed offline conversion data. The first may affect every online lead action. The second may affect only qualified-lead or closed-won imports, so the campaign scope should guide the exclusion range.

Let bidding stabilize before changing targets

Smart Bidding may need one or two normal conversion cycles to absorb corrected data. Give its learning process time to run after applying data exclusions. After an outage, short-term performance fluctuations don’t automatically call for seasonality adjustments.

Don’t chase short-term CPA or ROAS swings

Avoid sharply changing target CPA or target ROAS because of a temporary reporting dip. Otherwise, you can layer a bidding strategy change onto the original data problem. That can disrupt Smart Bidding and make either issue harder to diagnose.

Monitor spend, clicks, auction visibility, tracked conversions, and lead quality to assess campaign performance and bidding performance. For search campaigns, confirm that conversion tracking is working and the CRM import has resumed before deciding that a bid target needs adjustment.

Judge performance by qualified outcomes

Form fills are useful, but they are not always sales-ready opportunities. A job enquiry, spam submission, or out-of-area request can inflate conversion volume while weakening conversion value data used in value-based optimization.

Track qualified lead rate, booked appointments, proposal value, win rate, and sales-cycle length alongside campaign cost. A reliable cost per qualified lead view helps connect paid-search decisions to work your sales team can actually close.

If pipeline velocity falls while reported lead volume holds steady, investigate the sales process. Slower follow-up, stale proposals, or reduced win rates can explain the gap better than an ad-platform setting.

Build an incident process across teams and accounts

A short measurement incident log makes conversion tracking issues and related tracking failures easier to review later. Include the affected conversion action, technical cause, start and end times, date-range logic, campaign coverage, owner, and fix confirmation.

A digital marketing incident may start with a Website Development release. However, performance marketing, SEO, and social media marketing teams also need consistent lead definitions and source data. One shared record reduces reporting disputes after a form, consent tool, or CRM workflow changes.

Use the API carefully for multi-account work

Agencies and large service groups can automate approved data exclusions for Smart Bidding. Google’s Google Ads API create-exclusion sample uses the BiddingDataExclusion resource to create bidding data exclusions and supports campaign or channel targeting.

The API creates exclusions in client accounts, not manager accounts. For each child account, a manager-level process should identify affected search campaigns, validate the account’s local time zone and campaign scope, and create a separate record for every approved exclusion. Save the returned resource name and the evidence behind the decision.

If Google Ads totals, CRM outcomes, and call logs tell different stories, Get In Touch With Us for a practical review of your conversion reporting and tracking gap.

Frequently Asked Questions

What are Google Ads data exclusions?

Google Ads data exclusions tell Smart Bidding to disregard conversion data connected to clicks during a defined period affected by a tracking problem. They change bidding inputs without deleting conversions from standard reports.

When should a service business use a data exclusion?

Use one when you can confirm a conversion tracking failure, such as a broken form, stopped Google tag, or failed offline CRM import. A drop in leads without evidence of a technical issue usually calls for a review of demand, targeting, landing pages, or sales follow-up instead.

Do data exclusions remove conversions from Google Ads reports?

No. Excluded conversions can still appear in standard Google Ads reporting, so finance and sales teams retain the reporting record. The exclusion only protects the bidding model from learning from unreliable data during the affected period.

How should I choose the exclusion dates?

Base the range on the click dates that may have produced missing conversions, not only on the day the outage was discovered. Use the account time zone and extend the range far enough to reflect the normal conversion delay, while keeping it supported by outage evidence.

Keep Smart Bidding tied to trustworthy lead data

Google Ads data exclusions are an advanced bid control for proven conversion-data failures. They prevent automated bidding from treating a tracking outage as evidence that your best prospects have disappeared.

The strongest process combines diagnosing the outage with a click-date range that accounts for conversion delay. Then, allow bidding to stabilize after the fix. Trusted conversion data gives automated bidding a stronger basis for decisions and service teams a clearer view of campaign results.

Website Accessibility Audit for Lead Generation Websites

Laptop showing an accessible form with focus highlighting and booking icons.

A broken form label or trapped keyboard focus can turn an interested prospect into a lost lead. An accessibility audit finds the barriers that stop people from reading, comparing, contacting, or booking with your business. Inaccessible forms and booking paths can weaken digital accessibility and reduce completed leads.

For lead generation websites, accessibility affects more than compliance. It shapes form completion, trust, paid traffic efficiency, and lead quality. Inclusive design makes these benefits practical, while an audit shows where revenue-producing pages lose momentum.

Start with the journeys people must complete to become leads.

Key Takeaways

  • Start with revenue-producing journeys, including service pages, landing pages, lead forms, booking tools, and confirmation steps.
  • Combine automated scans with manual keyboard, screen reader, mobile, and user testing to uncover barriers that tools cannot judge.
  • Give forms, booking flows, PDFs, embedded tools, cookie banners, and other third-party components the same accessibility review as your own code.
  • Prioritize fixes by user harm, lead impact, reach, and effort, then retest conversion paths and measure changes in submissions, qualified leads, and bookings.

What an accessibility audit should examine first

A website accessibility audit is a structured review of web accessibility, including how people with disabilities use keyboards, screen readers, zoom, and other assistive technologies. It should cover live pages, shared templates, embedded tools, and the states users see after they click, submit, or make an error.

Lead-focused sites need a narrower first pass than a giant page inventory. Review the homepage, service pages, paid landing pages, contact forms, demo booking flows, live chat, pricing pages, and gated downloads before less important archive pages.

A UX specialist reviews audit notes and a laptop in a bright office.

Map the journeys that produce revenue

Trace each conversion path as a visitor would. Begin with an organic service-page visit, a Google Ads landing page, or a link from a social campaign. Then check every step until the person receives a clear confirmation.

Include phone-number links, sticky call-to-action buttons, multi-step forms, scheduling widgets, consent banners, and error messages. A visitor who cannot dismiss a cookie pop-up or reach the “Submit” button has no path to become a lead.

Also test on mobile. A compact layout can hide a focus indicator, place form errors off-screen, or make a tap target difficult to use.

Set a clear accessibility standard

The W3C’s WCAG overview explains the WCAG guidelines through four principles: content must be perceivable, operable, understandable, and robust.

Most commercial sites use WCAG 2.2 Level AA as a practical target for applying accessibility standards. WCAG conformance levels range from basic barriers at Level A to broader coverage at Level AA. Level AAA can guide individual improvements, but it’s rarely a realistic site-wide requirement.

Treat the audit as evidence that guides remediation and supports accessibility compliance, not as a certificate or guarantee of legal clearance. It can reduce legal risk, but obligations depend on your location, audience, and industry. ADA compliance may affect U.S. businesses, while Section 508 applies to federal information and communications technology. AODA and EAA compliance may apply based on where your business operates.

Combine automated scans with manual accessibility testing

Automated accessibility tools are useful for finding repeatable code-level accessibility problems quickly. However, they can’t decide whether a form makes sense, a screen reader announcement is helpful, or a keyboard user can finish a booking flow.

A strong audit combines scans with hands-on testing. The scanner points to likely defects, while a manual accessibility audit reveals whether people can actually use the page.

Laptop, keyboard, headphones, and phone arranged for accessibility testing.

Use scans to find common code issues

Run Lighthouse, axe DevTools, WAVE, or Siteimprove across representative templates. These tools can flag missing form labels, duplicate IDs, weak color contrast, skipped heading levels, empty buttons, and invalid ARIA attributes. They flag likely defects, but can’t establish whether a lead flow is genuinely usable.

Scan more than one URL. A homepage can pass a quick check while campaign pages, WordPress blocks, ecommerce templates, or CRM forms fail in different ways.

Automated checks work well in development and quality assurance because teams can repeat the same checks after each release. Save and compare repeatable Siteimprove results after releases, but a clean tool report still doesn’t prove a lead flow is usable.

Test what software cannot judge

Manual review must cover meaning, order, and behavior. It can uncover accessibility issues that automated scans can’t interpret, such as whether “image123” provides useful alt text. A scanner can detect a dialog element, yet miss a modal that sends focus behind the overlay.

Test keyboard navigation with Tab, Shift+Tab, Enter, Space, arrow keys, and Escape. Then use screen readers such as NVDA on Windows or VoiceOver on macOS and iOS to check key conversion pages.

For high-value conversion paths, add user testing alongside these checks with people who use assistive technologies.

A form can look perfect to a mouse user while its error message is invisible to a screen reader user.

Document the browser, device, technology used, page URL, steps to reproduce, and user impact for every issue. Developers can fix a well-written finding much faster than a vague note such as “form not accessible.”

Test lead forms, booking tools, and contact paths

Your primary form and booking tool deserve deeper testing than the rest of the page. They often include third-party scripts, conditional fields, validation rules, CAPTCHA, and tracking tags that can cause completion failures after a visual redesign.

The latest WCAG 2.2 standard adds criteria related to focus, target size, accessible authentication, and other interactions that matter on conversion pages.

Complete the form with keyboard navigation alone

Use a fresh browser session and complete the same lead form without a mouse. Follow the full path, including consent choices and confirmation screens.

  1. Tab through every control and confirm that focus stays visible at all times.
  2. Check that focus moves in a logical order, especially in multi-column forms and pop-ups.
  3. Trigger required-field and format errors, then confirm you can find and correct each one.
  4. Submit the form and verify that the confirmation, next step, or calendar message is reachable.

Avoid placeholder text as the only label. Users need persistent labels that explain each field before and after they enter information. Buttons also need clear names, such as “Book a consultation” rather than a vague icon or “Continue.”

Check what screen readers announce

Screen readers should announce a useful page title, heading structure, form labels, instructions, required status, and error feedback. If a user selects an invalid date or misses a required field, the message needs to be announced and programmatically associated with the relevant control.

Pay close attention to multi-step forms. A progress indicator should communicate the current step. When a new step loads, focus should move to useful content rather than remaining on a hidden button.

Complex booking and form flows also benefit from user testing with people who use them. Their feedback can reveal barriers that routine checks miss.

CAPTCHA can create another dead end. If your anti-spam method requires a visual puzzle, provide a workable alternative or choose a less intrusive approach.

Review content, PDFs, and third-party widgets

Web accessibility issues often begin outside the main theme. A polished service page can still fail when a booking calendar, chat panel, cookie banner, map, or document download blocks the next action.

Inventory every vendor script and every downloadable asset on pages that attract leads. Then assign an owner for testing and fixes.

Make helpful content usable in every format

Headings should describe the section that follows. Link text should explain the destination, and decorative images should not add noise for screen reader users. Meaningful images need text alternatives that describe their purpose in context.

PDF remediation matters for brochures, pricing sheets, application forms, and reports. A readable PDF has a logical reading order, tagged headings, descriptive links, usable tables, and searchable text. A scanned image of a document usually fails those basics.

For search engine optimization, AEO, and GEO, answer-first content with clear headings, meaningful links, and accessible structure supports inclusive design and discoverability. However, FAQ schema cannot repair a vague answer, an inaccessible accordion, or a broken form.

Hold third-party providers accountable

Test embedded Calendly-style schedulers, CRM forms, chat tools, payment tools, maps, and cookie platforms against the same accessibility standards as your own code. If an embedded tool blocks access, ask the vendor for a documented fix or provide another way to contact your team.

Avoid relying on accessiBe or any accessibility overlay as a repair strategy. A toolbar may offer contrast or text-size controls, but it cannot fix a missing input label, an illogical heading structure, or a keyboard trap in the underlying page.

For a current overview of how WCAG expectations intersect with ADA compliance, consult this ADA and WCAG compliance reference, then get legal advice for your own situation.

Prioritize fixes by lead impact and user harm

An accessibility report should give your team an ordered plan, not a spreadsheet full of warnings. Identify accessibility issues that prevent visitors from understanding an offer, accessing a service, or submitting an enquiry.

A keyboard trap in a quote form needs attention before a minor heading inconsistency on an old blog post. Likewise, a site-wide contrast failure often deserves priority because one design-token change may improve hundreds of pages.

Build a realistic remediation plan

Rank each issue by user harm, lead impact, reach, and effort. Start with shared templates and high-intent paths before isolated content fixes.

Use scope, template count, third-party dependencies, and development capacity to estimate the work. State which pages, devices, browsers, and assistive-technology combinations the reviewer will test.

Set the intended WCAG conformance levels and list what will be retested after each fix. Include developer guidance, retesting, PDF review, and third-party escalation in the plan.

Where ADA compliance obligations apply, involve qualified specialists; an audit can’t provide legal advice or guarantee an outcome.

PriorityTypical focusRecommended action
ImmediateLead forms, booking tools, and service accessFix before the next campaign or release
HighShared templates, contrast, and repeated content patternsResolve across the affected template set
PlannedIsolated pages, low-traffic content, and minor consistency issuesSchedule with normal content or development work

Measure outcomes after each release

Track digital accessibility improvements through form starts, successful submissions, validation errors, call clicks, and booking completions. Compare those signals with CRM outcomes such as contact rate, qualified lead rate, consultation rate, and lead-to-sale rate.

Retest priority conversion paths after each release with user testing and task-based checks.

Digital marketing, SEO, performance marketing, and social media marketing teams need this shared view. A form change that increases raw submissions but lowers qualified leads may have made the offer less clear.

Tools such as Siteimprove may surface additional findings. Route them into the same prioritized remediation workflow instead of treating tool output as the outcome.

Your website development team should also verify that fixes haven’t broken analytics. Pair the work with GA4 form tracking with Google Tag Manager so reported conversions match real enquiries.

For a hands-on review of accessibility barriers, lead-page structure, and conversion tracking, Get In Touch With Us.

Frequently Asked Questions

What is a website accessibility audit?

A website accessibility audit is a structured review of how well people with disabilities can use a website, including its content, forms, navigation, and interactive tools. It combines automated checks with manual testing using keyboards, screen readers, mobile devices, and other assistive technologies.

Should an accessibility audit focus on the entire website?

Begin with the pages and journeys that produce leads, such as service pages, paid landing pages, contact forms, booking flows, and confirmation screens. Shared templates, embedded tools, downloadable PDFs, and repeated components should also be reviewed because one issue can affect many pages.

Can automated accessibility tools prove that a website is accessible?

No. Tools such as Lighthouse, axe DevTools, WAVE, and Siteimprove can identify common code-level problems, but they cannot determine whether a form makes sense or whether a screen reader user can complete a booking flow. Manual testing and, for important journeys, user testing are still necessary.

What accessibility standard should a lead generation website target?

WCAG 2.2 Level AA is a practical target for most commercial websites. An audit can support accessibility compliance and reduce risk, but it is not a legal certificate or guarantee because obligations depend on the business’s location, audience, and industry.

How should accessibility issues be prioritized?

Rank issues by user harm, lead impact, reach, and implementation effort. Fix barriers that block high-intent actions, such as submitting a form or booking a consultation, before minor issues on low-traffic pages, then retest after each release.

Accessibility work that supports better leads

A quick homepage scan can’t show whether every prospect can request a quote, schedule a call, or understand a form error. The most useful website accessibility audit follows those real journeys and tests them with the tools people rely on.

Test revenue-critical paths, fix barriers that prevent completion, and retest after each release. Accessible paths give more visitors a fair chance to become qualified leads.

Local SEO Sentiment Analysis for Service Businesses

Smartphone showing ratings and review bubbles with local business analysis icons.

A five-star average can hide a growing problem. If recent customer reviews praise workmanship but complain about missed callbacks or surprise costs, your local reputation is weaker than the rating suggests.

Local SEO sentiment analysis helps service businesses read the meaning behind review language, then turn recurring feedback into better operations, profiles, pages, and lead handling. It doesn’t create a shortcut to the map pack, but it gives you evidence for data-driven decisions that affect trust and conversion.

Start by treating every review as both customer feedback and a record of what prospects may see before they call.

Key Takeaways

  • Local SEO sentiment analysis reveals the topics and emotions behind review ratings, helping service businesses identify recurring issues that a star average may conceal.
  • Sentiment is not a published Google ranking factor, but review insights can improve service delivery, customer trust, profile accuracy, website content, and lead conversion.
  • Tag reviews by sentiment and service topic, then validate automated labels with human review to account for sarcasm, mixed opinions, industry language, and limited data.
  • Turn recurring feedback into an owned action, such as improving response processes, clarifying pricing, updating service areas, or correcting Google Business Profile and website details.
  • Measure sentiment alongside profile actions, rankings, qualified leads, booked work, revenue, and pipeline performance rather than relying on word clouds or reputation metrics alone.

How local SEO sentiment analysis affects visibility

Google’s local search engine rankings depend mainly on relevance, distance, and prominence. These core local ranking factors appear in its local ranking guidance, which also states that a higher volume of reviews and positive ratings can help local ranking.

Reviews are useful local SEO signals, but sentiment itself isn’t a published ranking factor; it supports a broader local SEO strategy and complements technical SEO. Google doesn’t provide a scoring formula for phrases such as “fast plumber” or “great bedside manner.” It also doesn’t identify natural language processing, review replies, or sentiment scores as direct Google Business Profile ranking inputs.

Still, review analysis helps improve the inputs customers and search engines can observe. Clear service information, recent credible reviews, accurate business details, and a reliable user experience all support local search visibility.

A rising star rating paired with more mentions of “late,” “no callback,” or “unclear pricing” is a service alert, not a reputation win.

Review count and ratings fit within prominence, as this independent explanation of review signals outlines. More importantly, competitor analysis helps explain how detailed feedback influences a searcher’s choice among similar listings.

Reviews aren’t a public E-E-A-T score. However, genuine descriptions of completed work, communication, and outcomes strengthen brand reputation and provide trust signals for prospective customers.

Read review language, not only the star average

A star rating tells you the outcome. Sentiment analysis identifies the words, topics, and emotions that led to it.

A marketing manager reviews sentiment charts on a laptop in a bright office.

Separate sentiment polarity from the service topic

Each review provides customer feedback about a topic or experience. For example, “The repair was excellent, but the technician arrived two hours late” contains positive sentiment about workmanship and negative sentiment about punctuality.

Tag reviews by both polarity and subject. Useful service-business tags include:

  • Response speed, booking, arrival time, and follow-up
  • Price clarity, estimates, invoices, and financing
  • Work quality, cleanliness, staff behavior, and communication
  • Service-specific outcomes, such as pain relief, case handling, repair success, or project completion

This approach stops a good overall rating from concealing a repeatable problem.

Know what the software can and cannot read

Rules-based sentiment analysis tools, including VADER, score language using a predefined list of words and modifiers. They’re fast and inexpensive, although they can misread industry terms, sarcasm, and short comments.

Machine learning models use examples to identify patterns in context. Sentiment analysis tools such as Google Cloud Natural Language API categorize and score text at scale, while platforms such as Birdeye and ReviewTrackers package monitoring into a business dashboard. No such tool understands your service standards without human validation.

Review a small set of tagged comments every month. Compare sentiment scores and labels against real review samples. If software marks “They finally showed up” as positive because of “showed up,” correct the tag and record the reason.

Build a review process that produces useful feedback

A strong process for collecting customer reviews asks every eligible customer for honest customer feedback after a clear service milestone. For a roofer, that may be after the final walk-through. For a dental practice, it could follow a completed appointment. For a law firm, timing and confidentiality need greater care.

Ask at the moment of success

Send a short SMS or email while the experience is still fresh. Link customers directly to the correct location’s review form and make the request easy to complete on a phone.

Don’t steer only happy customers toward public reviews. A consistent request process produces more representative feedback and helps each branch build a credible review history. Third-party Google Maps review ranking studies can show useful patterns, but they should never become a fixed target for review volume or rating.

A practical Google Business Profile review workflow supports review management by tracking review frequency, response time, recurring topics, and the action taken after a complaint.

Reply to repair trust, not to chase rankings

Thank customers for a genuine positive review and refer to the work in general terms. For negative reviews, acknowledge the concern, avoid defensiveness, and offer an appropriate private route to resolve it. This thoughtful approach can support trust and future customer choice.

Healthcare, legal, and financial services need extra restraint. Never expose personal details, case facts, treatment information, or account data in a public reply.

Thoughtful replies are part of online reputation management, not a rankings shortcut. Google doesn’t publicly say that review responses raise rankings, but a calm, useful reply can influence prospective customers, recover a relationship, and reveal whether the same issue keeps appearing.

Turn recurring feedback into local SEO action

Sentiment data becomes valuable when someone owns the next step, while sentiment analysis tools flag recurring topics early. A negative theme should lead to an operational fix, a listing check, a page improvement, or a clearer sales promise.

Use a simple action log to connect feedback with the right team.

Review patternOperational checkSearch-facing update
Missed calls or slow arrivalCheck staffing, dispatch, and call-answer ratesCorrect hours and emergency availability
Estimate surprisesReview scope, quote process, and exclusionsExplain pricing approach on the service page
Praise for a specialist serviceConfirm the service is offered at that locationAdd accurate service details to the profile and page
Confusion about service areasCheck booking and routing rulesClarify service-area coverage and location pages

This feedback loop makes the local SEO strategy evidence-led. Review language should improve the business before it becomes copy.

Keep profiles and pages aligned with reality

If customers often praise same-day repairs, add that service only if every listed location can deliver it. If complaints mention a closed office or disconnected number, update the website, schema markup, citations, and Google Business Profile during the same technical SEO review.

Use citation tracking to verify that accurate names, addresses, phone numbers, hours, categories, and service descriptions stay consistent across citations. Use a GBP optimization checklist to review those basics before making bigger content changes.

Don’t copy review phrases onto a page just because they contain local keywords. Fix the underlying issue first to protect the user experience. Add real details about service scope, licensing, response process, pricing context, and coverage areas. Those details are more useful for people, traditional search, and AI-generated answers.

Compare locations and service lines separately

Multi-location reporting needs location-level context. A branch with fewer reviews may still have stronger sentiment around high-value work, while another location may receive more volume but repeated complaints about scheduling.

Segment review themes by location, service line, review source, and month. Use rank tracking tools to monitor branch-level visibility, and use competitor analysis to add search context. A home-services company should also separate emergency calls from planned installations, while a legal firm may compare sentiment around intake, communication, and case updates.

Measure outcomes beyond reputation metrics

A dashboard full of word clouds won’t tell you whether the business is growing. Compare sentiment scores with Google Business Profile actions, search engine rankings, website conversions, qualified leads, booked work, and closed revenue.

Use the right tool stack for your size

A single-location business can export reviews into a spreadsheet and tag them manually each month. Larger teams may use sentiment analysis tools alongside BrightLocal, Reputation.com, Birdeye, or ReviewTrackers to collect reviews across locations and route alerts. Pair review exports with rank tracking tools when measuring visibility.

Add a human quality check before reporting on sentiment. Watch the percentage of reviews that mention a topic, not only the total number of negative comments. Ten complaints in 1,000 reviews and ten complaints in 30 reviews require different responses.

Track technical SEO health as a separate baseline metric. Use competitor analysis to assess whether changes are specific to the business or broader in the market.

Use UTM tracking for local SEO to separate website visits from profile visits by location. That improves lead attribution and gives your team a clearer view of what happens after a prospect leaves Maps.

Connect feedback with lead quality and revenue

A strong review trend means little if calls go unanswered or enquiries are poor fits. Track customer satisfaction and sentiment trends alongside response time, qualified lead rate, estimate bookings, proposal-to-sale rate, and loss reasons.

For proposal-driven services, pipeline velocity offers another useful check:

Pipeline velocity = (qualified opportunities x average deal size x win rate) / average sales cycle length

This estimates expected revenue per day, not collected revenue. Compare it by source, service line, and branch. If positive sentiment rises but win rate falls, investigate the sales conversation, pricing, landing-page promise, or qualification process.

SEO, Performance Marketing, Social Media Marketing, and Website Development should use the same location naming and CRM rules. Digital Marketing becomes easier to judge when review themes connect to qualified conversations and revenue.

Use reviews to support GEO and AEO

Generative engine optimization, or GEO, focuses on how brands appear in AI-generated responses. Answer engine optimization, or AEO, helps pages provide direct, easy-to-extract answers for search features and assistants.

A review isn’t automatically an AI recommendation. An assistant may cite a source to confirm hours or service coverage without recommending the business. Track mentions, cited URLs, answer tone, and qualified enquiries separately. Use competitor analysis to compare the questions, sources, and evidence surfaced in AI-oriented results.

Publish evidence that answers local questions

Let validated review themes shape a content strategy that matches search intent and answers the local questions prospects actually ask. If customers regularly mention fast emergency response, publish the actual response process, service hours, coverage limits, and contact path. If reviews praise a specialist, explain qualifications and the types of jobs they handle.

Use crawlable page structure, clear headings, visible FAQs, accurate LocalBusiness details, and location-specific service pages in your technical SEO. Keep the Google Business Profile, location page, hours, and service coverage consistent. Schema markup can help systems interpret page details, but it’s a technical SEO aid, not a substitute for substantive content.

For more context on using reviews across local search and answer-oriented discovery, see these review practices for local GEO and AEO.

Set limits on automated sentiment scoring

Sentiment analysis tools can help triage review themes, but they aren’t authoritative judges. Sarcasm, slang, mixed opinions, cultural context, and very short reviews can produce inaccurate labels. A phrase such as “The wait was unbelievable” can be praise or criticism depending on context.

Low review volume can create false alarms. One unhappy review may deserve immediate outreach. It can coexist with broader positive sentiment without proving a systemic issue. Compare review counts, percentages, original text, operational records, and location trends before changing a process.

Keep the original review text available for human review, but restrict access when it may contain sensitive information. If profile actions, reviews, website conversions, and CRM outcomes point in different directions, Get In Touch With Us for a practical review of the gap.

Frequently Asked Questions

Is sentiment analysis a direct local ranking factor?

No. Google identifies relevance, distance, and prominence as core local ranking factors, and it has not stated that sentiment scores or review replies directly improve rankings. Sentiment analysis supports local SEO by revealing changes that can improve trust, service quality, and the accuracy of public business information.

What should service businesses analyze in customer reviews?

Analyze both sentiment polarity and the service topic behind it. Useful topics include response speed, arrival times, price clarity, work quality, communication, booking, follow-up, and service-specific outcomes.

Can automated sentiment analysis replace human review?

No. Automated tools can triage large volumes of feedback, but they may misunderstand sarcasm, slang, mixed opinions, short comments, or industry-specific language. Review a sample of tagged comments regularly and correct inaccurate labels before using the data for decisions.

How should businesses act on recurring negative sentiment?

Connect each recurring theme to an operational check, a listing update, a website improvement, or a clearer sales promise. Fix the underlying customer experience first, then update the Google Business Profile and public pages only when the information is accurate.

Which metrics should be measured alongside sentiment?

Compare sentiment trends with profile actions, search visibility, website conversions, qualified leads, estimate bookings, win rate, booked work, and closed revenue. These measures show whether reputation improvements are contributing to useful customer conversations and business growth.

Make sentiment part of the operating routine

A review-sentiment routine works best as a monthly operating habit, not a one-time software report. Read the themes, fix the customer experience behind them, and update public information only when it is true.

More reviews and positive ratings can support local prominence. Better service delivery gives those reviews a reason to exist. It also gives a local SEO strategy durable credibility, turning reputation data into lasting local growth.

Calculate Your Consultation-to-Proposal Conversion Rate

Speech bubbles flow through arrows toward a proposal document and rising conversion gauge.

Sending more proposals rarely repairs a weak sales process. If a discovery call includes a poor-fit prospect or unclear next steps, extra PDFs only create more follow-up work.

Your consultation proposal conversion rate shows how often a completed consultation moves through the sales funnel and becomes a commercial opportunity. This conversion rate gives consultants, agency owners, and sales teams a clear view of what happens between a conversation and a commercial offer.

Consultation Proposal Conversion Rate Formula

The basic calculation is:

Proposal conversion rate = (Proposals sent / Consultations held) x 100

For example, if your team holds 40 consultations and sends 18 proposals, the rate is 45%.

Use completed consultations as the starting point

Count consultations that actually happened, not bookings on a calendar. A no-show, cancellation, or rescheduled call shouldn’t inflate the denominator.

Also, count one proposal per opportunity. If a client asks for three revisions, it remains one proposal unless the scope becomes a separate project.

MetricFormulaWhat it reveals
Consultation-to-proposal rateProposals sent / consultations heldHow often meetings produce a commercial next step
Consultation qualification rateQualified consultations / consultations heldWhether the right prospects reach discovery
Proposal acceptance rateAccepted proposals / proposals sentWhether proposals convert into signed work

This measures one handoff in the sales funnel, so store it alongside other stages in your sales pipeline.

HubSpot’s explanation of sales conversion rates follows the same principle: divide the completed action by the relevant opportunity pool, then multiply by 100.

A consultant reviews sales metrics on a laptop at a bright office desk.

Build a Measurement Window You Can Trust

A consistent cohort window supports conversion rate optimization and gives the team a more reliable sales forecast. Start with a defined reporting period, such as consultations held in April, then measure whether each received a proposal within 14 days.

This cohort approach avoids a common reporting error. Counting April proposals against April consultations can distort the result when proposals came from calls held in March.

Define your CRM stages before reporting

Your sales pipeline should preserve the consultation date, attendance status, qualification decision, proposal date, proposal value, and final outcome. Add pricing models for segmentation when fee structures materially change proposal or acceptance behavior, and record a clear loss reason when a deal ends.

Keep definitions simple:

  • A consultation is held when the prospect and seller complete the scheduled conversation.
  • A qualified lead has a real need, a workable budget range, and access to the decision process.
  • A proposal is sent when the client receives a documented scope and commercial terms.

Attendance, qualification, proposal creation, acceptance, and response time are key performance indicators. A detailed request for a proposal should receive a human response within one business hour during working hours when possible.

Keep source data attached to every opportunity

SEO, Performance Marketing, Social Media Marketing, email marketing, and referrals can all support lead generation. These channels may create consultations with different intent levels, fit, and proposal rates.

Landing page optimization should measure downstream consultation quality, not just bookings. One round of A/B testing can compare page variables such as social proof and a clear call to action.

Use stable UTM parameters and preserve the original source through every stage of the sales funnel for consistent analytics tracking. GA4 custom channel groups help keep SEO, GEO, AEO, paid media, and referral performance separate before leads move into the CRM. Automated workflows can support reminders, routing, and data consistency, while prompt human follow-up remains necessary.

Find the Bottleneck Behind a Low Rate

A low consultation proposal conversion rate doesn’t automatically mean the proposal is weak. It may point to targeting, call quality, response time, or unclear qualification.

Stage conversion analysis helps isolate where opportunities stop moving through the sales funnel and sales pipeline.

Compare the rate with nearby pipeline stages

Review these patterns each month:

  • A high booking rate but low attendance rate points to reminders, scheduling, or low-intent bookings.
  • Many held consultations but few qualified opportunities suggest weak targeting or vague discovery questions that fail to identify a qualified lead.
  • Strong qualification but few proposals often means delayed follow-up, unclear ownership, or a slow internal pricing process.
  • Healthy proposal volume but low acceptance calls for a closer look at scope, value, pricing models, and procurement steps. A monthly retainer may need separate cohort analysis from other offerings.

For example, 40 held consultations, 25 qualified opportunities, and 18 proposals produce a 45% raw consultation-to-proposal rate. The qualified-consultation-to-proposal rate is 72%. Both figures matter.

Separate proposal creation from proposal acceptance

Don’t combine this metric with your close rate. Proposal acceptance measures whether prospects approve what you sent. The standard formula is accepted proposals divided by total proposals sent, as outlined in this proposal conversion rate guide.

A software as a service company may track acceptance differently from a consulting firm. The numerator and denominator distinction remains the same. The diagnostic goal is more predictable closing deals, not simply higher proposal volume.

A higher proposal rate is not always better if it comes from sending detailed offers to prospects who were never likely to buy.

Improve Proposal Volume Without Lowering Lead Quality

The strongest conversion rate optimization work often happens during qualification and discovery, before a document is created. A discovery call needs enough detail to decide whether a tailored offer makes commercial sense.

A consultant reviews blank proposal pages beside a calculator and pen.

Qualify the opportunity during the consultation

Ask about the business problem, desired outcome, budget range, timeline, stakeholders, and approval process. For an SEO or Performance Marketing engagement, also confirm what data, access, and internal resources the client can provide.

A prospect doesn’t need every answer immediately. Still, you need enough context to avoid writing a speculative proposal that misses the real decision criteria.

Make the proposal easy to approve

A strong proposal strategy makes approval easier. A consulting proposal should restate the client’s situation in their own language. It should show the recommended scope, milestones, responsibilities, investment, and next approval step. Explain the value proposition by showing why the recommended work matters to the client.

A fixed-fee project, a monthly retainer, and performance-based pricing are useful pricing models in the right context. Before discounting or linking fees to outcomes, calculate your break-even point using delivery hours, software costs, media management, and required margin. Compare those delivery economics with customer lifetime value when recurring work or expansion potential matters.

Use relevant social proof, such as a comparable result or client example, to support the recommendation. End with a clear call to action that tells the buyer what to approve or schedule next, and plan a structured proposal follow-up sequence so the deal keeps moving after the document lands.

For high-volume proposal templates, subject lines, or approval flows, A/B testing can reveal useful patterns. Small consulting teams shouldn’t treat tiny samples as conclusive.

Deals covered by master service agreements and sole-source requests often move faster because the buying path is clearer. Tag sole-source requests and competitive bidding separately. Track these categories in the sales pipeline so they don’t make the general new-business proposal rate look artificially strong.

If your reporting can’t connect consultation quality, proposal activity, and marketing source, Get In Touch With Us for a practical review.

Frequently Asked Questions

What is a consultation proposal conversion rate?

It measures how often completed consultations lead to a proposal being sent. Calculate it by dividing proposals sent by consultations held, then multiplying by 100.

Should no-shows and cancellations count as consultations?

No. Use completed consultations as the denominator so no-shows, cancellations, and rescheduled calls don’t distort the rate.

What is a healthy consultation proposal conversion rate?

There is no universal benchmark because rates vary by service, lead source, qualification process, and pricing model. Compare the rate across consistent cohorts and review it alongside qualification and proposal acceptance.

Is consultation-to-proposal rate the same as proposal acceptance rate?

No. Consultation-to-proposal rate measures how often meetings produce proposals, while proposal acceptance rate measures how often those proposals become accepted work. Keeping the stages separate makes bottlenecks easier to identify.

How can a team improve this conversion rate?

Improve qualification and discovery before creating a proposal, then follow up quickly with a clear scope, investment, responsibilities, and next approval step. Track the rate by source and pricing model to distinguish lead-quality issues from proposal or sales-process issues.

Final Thoughts

A useful measure starts with clean stage definitions and completed consultations, not calendar bookings or raw lead totals.

Track it alongside qualification, proposal acceptance, response time, and source quality. These key performance indicators, segmented by pricing models, show whether your team needs better leads, sharper discovery calls, or proposals that make a confident next step easier.

Ecommerce Contribution Margin Reporting by Channel

A glowing scale surrounded by ecommerce packages, receipts, and colorful channel streams.

A campaign can report a 5x ROAS and still reduce the cash available to run your business. That happens when the report stops at revenue and ignores the real cost of fulfilling, refunding, and acquiring each order.

An ecommerce contribution margin report gives finance and marketing financial visibility into what each channel leaves after its variable costs. It gives both teams a practical way to decide where to increase spend, where to fix operations, and where revenue is hiding an expensive problem.

The goal isn’t a prettier dashboard. It’s a consistent view of profitable orders.

Key Takeaways

  • Ecommerce contribution margin shows what each channel leaves after variable costs, including COGS, fulfillment, payment fees, shipping, returns, and attributed marketing spend.
  • Use consistent margin tiers, such as CM1 for pre-marketing contribution and CM2 for post-ad-spend contribution, so finance and marketing compare the same figures.
  • Separate sales channels from marketing sources, and apply stable attribution rules to avoid misleading channel and campaign comparisons.
  • Build the report from order-level data, reconcile it with commerce, fulfillment, payment, marketplace, and advertising records, and close cohorts after an appropriate return window.
  • Use contribution dollars and margin rates—not ROAS alone—to set budgets and improve fulfillment, product mix, pricing, and media decisions.

Ecommerce Contribution Margin by Channel: What It Measures

Contribution margin is revenue left after variable costs rise with each sale. That remaining amount helps cover fixed costs, moves the business toward its break-even point, and eventually becomes net profit.

At the channel level, this is a unit economics question: after a source brings in an order, how much money does that order contribute to the business?

Gross margin is only the first layer

Gross margin subtracts cost of goods sold (COGS) from revenue. It helps assess product economics, but excludes acquisition, fulfillment, and support costs.

A brand can report 65% at the product level and still lose money on paid orders after advertising, pick-and-pack fees, shipping subsidies, payment fees, and returns. A clear comparison of contribution margin and gross margin shows why both measures belong in management reporting.

For ecommerce, use net revenue rather than checkout revenue. Remove discounts, cancellations, refunds, and sales tax that never belongs to the business.

A finance manager reviews charts beside a calculator, payment card, shipping box, and small parcels.

Define margin tiers before comparing channels

Finance teams often use contribution margin tiers. The labels can differ, so write down each definition before anyone reviews the figures.

  • CM1 removes variable costs tied to each order, including COGS, fulfillment costs, packaging, payment fees, shipping fees, marketplace fees, and return handling.
  • CM2 removes direct, attributable marketing spend from CM1, such as Google Ads, Meta ads, affiliate commission, or creator commission.
  • CM3 can remove other variable selling costs, such as a per-order sales commission or customer-service cost. Keep fixed agency retainers and permanent payroll outside this tier unless your policy says otherwise.

A useful ecommerce contribution margin report makes these layers visible. Otherwise, different teams may compare different margin layers, with marketing celebrating CM1 while finance focuses on negative CM2 after paid media.

Calculate Margin With Costs That Match Each Order

The basic calculation is simple. Assigning variable costs to the correct order, SKU, sales channel, and marketing source is the hard work behind auditable unit economics.

Use a formula your teams can audit

Start with these calculations:

CM1 = net revenue – variable costs

CM2 = CM1 – attributed marketing spend

Contribution margin ratio = CM2 / net revenue x 100

The underlying logic matches standard ecommerce contribution margin calculations: the revenue base must absorb every cost that changes as sales volume changes.

Consider a paid-search cohort with $120,000 in checkout sales.

ItemAmount
Checkout sales$120,000
Discounts and refunds($12,000)
Net revenue$108,000
Cost of goods sold (COGS)($38,000)
Fulfillment, packaging, and delivery($10,000)
Payment processing fees and platform fees($5,000)
Shipping fees($5,000)
Return handling($2,000)
CM1$48,000
Paid-search spend($21,600)
CM2$26,400

This cohort produced a 24.4% CM2. That is more useful than its revenue total alone.

The $26,400 CM2 can be compared with the cohort’s break-even point. Use customer acquisition cost as a separate cohort-level check against the $21,600 attributed paid-media spend.

Do not deduct refunded revenue and the full product cost twice. If returned inventory is resellable, account for its recovered value according to your accounting policy. Also decide whether customer-paid shipping counts as revenue, then apply that rule to every channel.

Separate Sales Channels From Marketing Sources

A channel report becomes confusing when data fragmentation merges sales destinations with marketing sources. An ecommerce contribution margin report needs both dimensions because they answer different questions.

Use two reporting dimensions

Your sales channel identifies where the order occurred. Common examples include a Shopify store as a direct to consumer (DTC) sales channel, Amazon, a retail marketplace, wholesale, and a physical point of sale.

Your marketing source identifies what helped acquire the order, such as Google Ads, paid social, email, referral traffic, SEO, an affiliate, or direct traffic. This dimension supports comparing customer acquisition cost by source or campaign.

A Meta campaign that sends shoppers to a Shopify store is a paid-social marketing source and a DTC sales-channel order. Amazon Advertising may acquire an order within Amazon, while Amazon itself remains the sales channel.

Wholesale needs its own cost treatment, and channel-specific rules should follow the order destination because variable costs differ. Net revenue should account for trade discounts, allowances, chargebacks, freight commitments, carrier charges, and sales commissions. Amazon orders need marketplace commissions, Amazon FBA fees, storage costs where material, advertising, and return costs.

Keep an “unattributed or direct” bucket instead of forcing every sale into a paid channel. False precision creates worse budget decisions than an honest unknown.

Set attribution rules and keep them stable

Choose an attribution model before comparing paid search, social, email, and organic activity. Many brands use a last non-direct click view for operational decisions, then review assisted conversions and blended performance alongside it.

Separate first-time buyers from returning customers. A retention email should not be judged by the same acquisition target as a prospecting campaign. Likewise, SEO can create demand weeks before a shopper returns through branded search.

Digital Marketing reporting becomes more reliable when source definitions stay stable. Consistent UTMs and GA4 custom channel groups help keep paid, organic, referral, and email traffic distinct.

GA4 will not match Shopify or an ERP exactly. Analytics records sessions and events, while finance should report completed, net orders. Reconcile those systems instead of assuming either number is wrong.

Build a Channel Contribution Margin Report That Teams Will Use

Start at the order level to establish a reliable ecommerce contribution margin report. Roll data into campaigns, channels, product groups, and periods. The same records can support inventory management, SKU decisions, and stock planning. A spreadsheet can work for an early-stage brand if definitions and data checks are disciplined.

Sales channels flow into a dashboard showing ecommerce revenue and costs.

Capture the fields that explain margin movement

Each order record should include order date, order ID, SKU, quantity, gross revenue, discounts, refunds, tax, adjusted revenue, sales channel, marketing source, campaign, customer type, and location.

Then add the variable costs tied to each order: cost of goods sold (COGS), fulfillment costs, packaging, carrier cost, payment processing fees, marketplace commission, return label cost, return-processing cost, and attributable ad spend. Keep fixed costs outside the order-level contribution feed unless your reporting policy explicitly allocates them.

Pull revenue from Shopify, Amazon Seller Central, or your ERP. Pull fulfillment data from a warehouse or third party logistics provider (3PL). Import ad spend directly from Google Ads, Meta, TikTok, or affiliate platforms. Match costs to order IDs where possible, and use documented allocation rules when a direct match isn’t possible.

Review daily, then close the cohort

A daily report is useful for pacing media and spotting sudden cost changes. It is not final profit, because returns, cancellations, and delayed fulfillment invoices can arrive later.

Lock a monthly cohort after a return window that fits your category. Apparel brands with high return rates may need a longer review period than beauty brands with low return behavior.

Check three controls before circulating the report:

  • Net sales should reconcile to the commerce platform after agreed timing adjustments.
  • Paid-media spend should reconcile to the platform invoice, not only the campaign dashboard.
  • Contribution costs should reconcile to the 3PL, payment processor, marketplace, and return records.

This keeps a daily forecast useful without treating it as collected cash or recognized net profit.

Use Contribution Margin Before ROAS to Set Budgets

Set budgets with ecommerce contribution margin before return on ad spend (ROAS), a bidding metric. It divides attributed revenue by ad spend but cannot see variable costs from product economics, shipping losses, refunds, or fulfillment effects. That is why profit on ad spend provides a better bridge between media buying and financial outcomes.

Compare margin dollars and margin rate

A 35% CM2 on $10,000 in sales creates $3,500 in contribution, while a 20% CM2 on $200,000 creates $40,000. Gross margin describes product economics, while the contribution margin ratio and contribution dollars guide post-ad-spend budget changes. A higher average order value doesn’t guarantee a stronger contribution result.

Many direct to consumer brands use a 20% to 35% post-ad-spend contribution margin as a planning range. The right floor depends on product mix, return rates, repeat purchase rate, inventory risk, and fixed costs. The break-even point depends on the overhead those contribution dollars must cover; CM2 is a planning measure, not the same as final business profit margins.

Performance marketing teams should set margin floors by campaign type and product group. Set a customer acquisition cost ceiling for each campaign or cohort using contribution dollars, not attributed ad spend alone. A prospecting campaign may accept a lower first-order margin if retention data shows repeat purchases improve the customer’s unit economics.

Social media marketing also deserves a separate attribution review because it often creates demand that returns through search or direct traffic.

Website development changes need the same financial test. A new landing page can lift conversion rate while changing pricing strategies, increasing discount use, pushing shoppers toward low-margin SKUs, or increasing returns.

Improve Margin Through Fulfillment, Product, and Media Decisions

An ecommerce contribution margin report becomes valuable when it changes fulfillment, product, and media decisions.

Reduce variable costs that rise with each order

Review carrier zones, package dimensions, fulfillment costs, and shipping thresholds by SKU. Right-sized packaging can lower dimensional-weight charges and shipping fees. Bundling can raise average order value without adding a second shipment.

Return rates deserve close attention. A size guide, better product photography, clearer ingredient detail, or accurate delivery expectations can protect margin. These changes may matter more than a small bid adjustment.

Payment processing fees and marketplace commissions also matter. Negotiate where volume supports it, but don’t spread a new contract benefit across all channels until the savings actually apply.

Protect SKU-level profitability

A channel may look healthy while a promoted product loses money on each unit. Product mix can hide that weakness.

Report sku level profitability and product-family results beside campaign performance.

Use that view to exclude loss-making products from paid campaigns, change bundles, reduce discounts, or test pricing strategies where demand allows. For organic growth, ROI-focused ecommerce SEO should prioritize categories that can convert without relying on margin-eroding promotions.

If your ad platforms, storefront, fulfillment data, and finance records disagree, Get In Touch With Us for a practical review of the tracking, attribution, and reporting gaps.

Frequently Asked Questions

What is ecommerce contribution margin?

Ecommerce contribution margin is the revenue left after the variable costs required to acquire, fulfill, and support an order. It shows how much each order or channel contributes toward fixed costs, break-even, and net profit.

What is the difference between CM1 and CM2?

CM1 subtracts variable order costs such as COGS, fulfillment, payment fees, shipping, marketplace fees, and return handling from net revenue. CM2 also subtracts attributable marketing spend, making it a useful measure for evaluating post-ad-spend performance.

Why is contribution margin more useful than ROAS for budgeting?

ROAS measures attributed revenue against advertising spend but ignores costs such as products, shipping, fulfillment, refunds, and returns. Contribution margin includes those variable costs, so it gives a clearer basis for setting budgets and campaign margin floors.

Should sales channels and marketing sources be reported separately?

Yes. A sales channel identifies where the order occurred, while a marketing source identifies what helped acquire it; reporting both dimensions prevents confusion between destinations such as Amazon or Shopify and sources such as Google Ads, email, or SEO.

How often should an ecommerce contribution margin report be reviewed?

Review it daily for media pacing and sudden cost changes, but do not treat daily figures as final profit. Close monthly cohorts after a return window that fits the category, then reconcile revenue, advertising spend, fulfillment, payment, marketplace, and return records.

Make Every Revenue Report a Profitability Report

Revenue and return on ad spend can show momentum, but neither proves profitable growth. Ecommerce contribution margin connects marketing spend to the variable costs that occur after an order is placed.

Use stable definitions, order-level data, and realistic attribution rules. When finance and marketing review the same channel contribution margin view, budget decisions become more direct. Teams can protect profit margins, assess the break-even point, and prioritize net profit.

Opportunity Aging Reports That Rescue Stalled Service Deals

Laptop dashboard with fading pipeline circles, an hourglass, calendar, and folders on a tidy desk.

An inflated pipeline can make a sales team feel safer than it is. These reports expose deals that have sat too long, lost momentum, or lack a credible next step.

For service businesses, stale proposals drain attention and distort forecasts. A useful report shows where opportunities are slowing down, who owns the next action, and which deals deserve a reset or a clean exit.

Service businesses that stock parts or other goods can pair pipeline aging with an inventory aging report. Both can support cash flow management and a broader financial health review. Together, they create a working financial document, not a complete financial statement.

Key Takeaways

  • Opportunity aging reports show how long deals have remained open or stalled in a sales stage, revealing risks that total pipeline value can hide.
  • Track opportunity age, stage age, and the date of the last meaningful customer activity separately because each measure reflects a different aspect of deal health.
  • Set aging buckets around the real sales cycle and require buyer-confirmed events, clear next steps, and named owners to keep reports useful.
  • Use weekly reviews to re-engage, re-qualify, nurture, or close aging opportunities instead of allowing stale deals to distort forecasts.
  • Keep opportunity aging separate from inventory, accounts receivable, and accounts payable aging, while connecting relevant cross-functional data for cash flow and operational decisions.

Opportunity aging reports reveal stalled work

An opportunity aging report groups open deals by the time they have spent in the pipeline or a particular sales stage. It differs from an accounts receivable aging report, which tracks unpaid invoices after a sale.

Related reports support different operational reviews. An accounts receivable aging report groups outstanding invoices by invoice date, so a finance or sales leader can review overdue accounts and the outstanding balance for a credit risk assessment. The same view can reveal whether older outstanding invoices need collection action.

An inventory aging report measures how long stock has remained unsold. An ERP such as NetSuite can supply data for these reports.

Report typePrimary use
Accounts payable aging reportTracks supplier obligations rather than buyer opportunities.
Inventory aging reportGroups stock by time unsold, supporting inventory review.

Each report uses different aging buckets because its clock starts at a different business event. For readers with a hybrid product channel, one example is Amazon FBA, which can provide product data alongside service pipeline data.

Sales teams need this pre-sale view because total pipeline value hides risk. A $150,000 proposal that has waited 80 days without buyer activity should not carry the same forecast weight as a fresh proposal with a scheduled decision meeting.

A sales manager reviews colorful pipeline charts on a laptop in a modern office.

Pipeline totals do not show deal health

A pipeline dashboard may show stage, amount, close date, and probability. Those fields matter, yet they often miss the real story: whether a buyer has taken a meaningful step forward.

Time-based evidence adds another layer. They help sales leaders spot:

  • Deals with no meeting, reply, or decision milestone in the expected period.
  • Opportunities that sit in proposal or negotiation far longer than similar wins.
  • Reps who keep moving close dates instead of confirming buyer intent.
  • High-value accounts that need executive attention before competitors gain ground.

These reports complement, rather than replace, the opportunity view. A service business that sells equipment might use an inventory aging report to flag slow-moving inventory, while its sales team identifies stalled buyer work in Salesforce.

Salesforce supports an Age field in opportunity reports that counts days since the opportunity was created. Its opportunity reporting guidance also shows how teams can add fields that provide more detail to each deal. NetSuite can provide ERP-side reporting, while Salesforce keeps this pre-sale view focused on buyer progress.

Separate opportunity age from stage age

Opportunity age counts calendar days since the record was created. Stage age counts days since the opportunity entered its current stage. Days since last meaningful activity shows whether the buyer conversation has gone cold.

Each measure answers a different question. An 80-day-old deal may be healthy if it has progressed through a complex procurement process. However, a deal that has spent 45 days in “Proposal Sent” without a buyer meeting needs scrutiny.

An inventory aging report addresses a different issue. Deadstock creates carrying costs, while a stalled opportunity signals delayed buyer action.

If an opportunity can change stages without a customer event, stage age tracks CRM behavior rather than buyer progress.

Set aging buckets around your real sales cycle

Generic aging periods such as 0 to 30, 31 to 60, 61 to 90, and 90-plus days make reports easy to scan. However, service sales cycles vary widely.

A local repair company may expect a decision within days. A B2B consultancy may need several months for stakeholder review, budget approval, and contracting. Start with broad aging buckets, then calibrate those aging periods by stage and service line.

Opportunity ageWhat it may meanSales response
0 to 14 daysNew and activeConfirm discovery, owner, and next meeting
15 to 30 daysEarly slowdownReview fit and buyer engagement
31 to 60 daysDeal needs interventionRework the plan with the rep
61 to 90 daysForecast risk is highInvolve a manager or reset the close date
90-plus daysLikely stalled or parkedClose, recycle, or move to nurture

The table creates a common language, but aging buckets are more useful when they reflect each stage and service line. A two-week discovery stage may be normal for a managed IT provider. A two-week delay after a signed scope request may be a serious warning.

Cross-functional note: Service businesses that also manage parts, equipment, or productized offerings may need an inventory aging report for stock age, while opportunity age tracks buyer progress. These views answer different questions, so their thresholds shouldn’t be copied directly.

An inventory aging report might flag slow-moving inventory after 90 days, while a service line may treat 30 days without buyer action as old. Those aging buckets reflect sales-stage duration, not days sales in inventory. Deadstock and excess inventory can create carrying costs, but those issues don’t automatically indicate a stalled deal.

NetSuite can provide item age and availability data to an inventory aging report and inventory planning software. Teams can configure inventory planning software thresholds in NetSuite for stock reviews, while sales thresholds remain tied to buyer commitments.

During a weekly review, inventory planning software and NetSuite can help teams prioritize replenishment decisions. A hybrid service-commerce team may review Amazon FBA data separately, since Amazon FBA demand patterns don’t define service-stage progress.

Use the inventory aging report as a separate operational signal, then connect only relevant stock constraints to opportunity age.

Use customer commitments as your benchmark

A buyer-confirmed event should drive movement between aging buckets. Examples include a discovery call, site survey, proposal review, stakeholder meeting, legal review, or verbal selection.

Internal CRM activity can support the record, but it shouldn’t reset the clock by itself. A rep logging a note or sending an automated email doesn’t prove that the opportunity moved forward.

Strong stage definitions matter here. Teams benefit from clear opportunity stage practices that connect each stage to evidence, exit criteria, and realistic buyer actions.

Build a report reps can use every week

These reports fail when they become another dashboard nobody opens. Keep the first version focused on decisions a manager and account executive can make during a weekly pipeline review.

Each row should include opportunity name, owner, service line, source, amount, current stage, opportunity age, stage age, last meaningful activity date, next step, next-step date, expected close date, and forecast category. Add a short reason code when a deal becomes overdue. For hybrid teams, add product context separately, including inventory age and normalized aging buckets from an inventory aging report.

Start with dependable CRM data

A CRM can calculate opportunity age from the created date. In a spreadsheet, use a simple date difference such as TODAY() - Created Date. Stage age requires a date stamp when the stage last changed, or access to stage-history data.

Do not rely on expected close date alone. Reps often move close dates forward when a deal slips, which can make an old opportunity look current. Keep the original creation date visible, then compare it with the most recent verified customer action.

For teams using Google Sheets or Excel, export open opportunities weekly and preserve a dated snapshot. Pair it with the weekly inventory aging report when product revenue is involved, and preserve the matching NetSuite export. Use dated snapshots to track movement between aging buckets over time.

Service companies with stocked parts or hybrid product revenue need a cross-system check. CRM opportunity age isn’t the same measure as an ERP or inventory system’s stock age.

Inventory planning software may calculate stock age from receipt date, while the CRM counts from opportunity creation. Inventory planning software can also alert the team when an item reaches a defined threshold. Use automation software for alerts or scheduled exports, while keeping the source calculation intact.

Use NetSuite for the ERP export when applicable. The export should carry source values from an inventory aging report. Map NetSuite item, location, quantity, and age fields before joining them to CRM opportunity and service-line data.

Create a saved report or search in NetSuite for those fields each week. Join the inventory aging report to CRM records only when product revenue affects the deal. This shows whether a service opportunity depends on stocked parts, without changing its opportunity age.

Validate one sample against an inventory aging report before publishing the joined view. During validation, compare the source record with its NetSuite values.

Connect source data to deal quality

Source data turns aging into a shared sales and marketing conversation. SEO may attract buyers who research longer before they engage. Performance marketing can create faster demand, while social media marketing often supports awareness and retargeting. Website development can also change lead quality by changing the offer, form questions, or conversion path.

Amazon FBA and service work may share one account, so tag product revenue separately. An inventory aging report can flag deadstock that needs a service conversation, without changing opportunity age.

Use documented lead source naming conventions so “Google Ads,” “paid search,” and “PPC” do not appear as separate sources for the same channel. Digital marketing reports should connect cleanly to CRM outcomes.

For GEO and AEO activity, keep AI citations, recommendation language, referral sessions, and qualified opportunities separate. A cited page may validate one detail in an AI answer without producing a sales conversation or a booked consultation.

Reconcile inventory planning software totals with CRM outcomes before trusting the joined view. Keep the inventory aging report’s source fields and refresh time documented.

Turn old opportunities into focused sales action

The report should prompt action, not blame. A stalled deal may reveal poor qualification, buyer uncertainty, a pricing objection, missing stakeholders, or an internal handoff problem. An inventory aging report can add stock context without shifting attention from opportunities.

Start with the largest and most recoverable opportunities, using an inventory aging report to identify comparable stock exposure. Then review patterns by service line, source, stage, and owner. A cluster of aging proposals may point to a weak proposal process, while an inventory aging report may expose related stock risk in that service line.

Cross-functional teams can compare these signals without treating them as interchangeable. A stalled sales deal and an aging stock position both need a named owner, supporting evidence, and a clear exit decision. NetSuite and inventory planning software can provide shared data, with Amazon FBA records adding context in hybrid commerce. Teams can verify the owner and evidence in NetSuite or inventory planning software before action. Use aging buckets to prioritize late-stage deals and stock exposure, but don’t treat the measures as interchangeable. This comparison may reveal slow-moving inventory needing demand re-qualification, deadstock calling for a changed offer, or excess inventory requiring an escalated decision. A second deadstock signal can justify reviewing carrying costs rather than assigning blame.

A professional views a laptop and wall display showing sales pipeline stages and follow-up progress.

Run a short weekly aging review

A 15-minute review works when every flagged opportunity ends with a named action and date. Managers should ask what changed with the buyer, what evidence supports the forecast, and what must happen next. Automation software can route overdue reviews and generate owner/date reminders.

Use a small set of consistent responses:

  • Re-engage deals with a relevant reason to talk, such as a revised scope, capacity window, or unanswered question.
  • Pull in a senior seller when deal value is high and decision-makers are absent.
  • Re-qualify opportunities outside the service area, budget, timing, or buyer authority. Check an inventory aging report when related demand affects stock.
  • Move genuinely inactive deals to nurture or close them as lost with an honest reason code.

Closing a dead opportunity improves the forecast. It also gives the sales team cleaner data for future targeting and follow-up.

Compare aging with pipeline velocity

Pipeline velocity estimates expected revenue per day using qualified opportunities, average deal size, win rate, and average sales cycle length:

Pipeline velocity = (qualified opportunities x average deal size x win rate) / average sales cycle length

This is a planning metric, not collected or recognized revenue. When aging rises in late stages, average cycle length often increases and velocity falls.

Review velocity alongside the sales aging report and the inventory aging report by channel and service type. Stalled deals delay expected inflows, while tied-up stock limits planning flexibility. That matters for cash flow management, but days sales in inventory remains a separate stock measure, not a substitute for sales velocity. Clear measures also support operational efficiency.

Opportunity management best practices support the same discipline: consistent stages and clean opportunity ownership make sales reporting more credible.

Managers should keep the inventory aging report separate from sales velocity, while using both views to assign owners, test evidence, and make timely exit decisions.

Keep the report honest

Aging data becomes misleading when teams create opportunities too early or advance stages without proof. Set a written qualification rule before an enquiry becomes an opportunity.

For a service business, that rule may include service fit, estimated value, location or market fit, access to the decision-maker, and a plausible buying timeframe. Require a future next step for every open opportunity, then define what counts as a meaningful activity.

Sales managers should also separate parked deals from active pipeline. A prospect who asks to revisit next quarter may still have value, but it should not inflate this month’s forecast.

Use an accounts receivable aging report and an accounts payable aging report in a monthly reconciliation checklist. Review outstanding invoices by invoice date, payment terms, overdue accounts, and outstanding balance. Investigate mismatches before they distort the forecast.

Review outstanding invoices weekly, and document why late items remain open. Don’t treat every delay alike, since early payment discounts can change its risk. Add a credit risk assessment when payment behavior affects qualification or forecast confidence.

Set written aging periods for parked opportunities, receivables, and stocked parts. Use matching aging buckets to guide each review.

Use an inventory aging report to flag slow-moving inventory before it becomes a purchasing issue. Review the inventory aging report for excess inventory, demand, reorder plans, and carrying costs.

When an inventory aging report identifies deadstock, set a disposition date. Review remaining deadstock for sale, return, or write-off.

Reconcile the inventory aging report in NetSuite with CRM demand and order records. Reconcile outstanding invoices against CRM stages and payment records.

This supports cash flow management across sales timing, collections, payables, and stock decisions. It also clarifies financial health, including liquidity and solvency. Track days payable outstanding to add context to supplier timing.

An inventory aging report in NetSuite or inventory planning software can support exception reviews. Use automation software to send reminders when records need attention.

When marketing attribution, form tracking, and CRM outcomes tell different stories, Get In Touch With Us for a practical review of lead tracking and conversion gaps.

Frequently Asked Questions

What is an opportunity aging report?

An opportunity aging report groups open sales opportunities by how long they have been in the pipeline or a particular stage. It helps teams identify stalled deals, weak buyer engagement, and forecast risk.

How is opportunity age different from stage age?

Opportunity age counts calendar days since the opportunity was created, while stage age counts days since it entered its current stage. Reviewing both can show whether a deal is broadly old or stuck at a specific point in the sales process.

What should count as meaningful activity?

Meaningful activity is a buyer-confirmed event such as a discovery call, proposal review, stakeholder meeting, legal review, or agreed decision milestone. Internal notes or automated emails should not reset the aging clock on their own.

How often should sales teams review aging opportunities?

A short weekly review is usually enough to assign an owner, confirm evidence, and set a dated next action for every flagged deal. Opportunities with no credible next step should be re-qualified, moved to nurture, or closed as lost.

Can opportunity aging be combined with inventory aging?

The reports can be reviewed together when stocked parts or product revenue affect a service deal, but they measure different business events. Opportunity age tracks buyer progress, while inventory aging tracks how long stock has remained unsold.

Build a pipeline that reflects reality

Opportunity aging reports give sales leaders an early warning before monthly forecasts fail. They reveal stalled proposals, expose weak stage discipline, and help reps spend time where progress is still possible.

The strongest report combines age, buyer activity, next steps, source quality, and service-line context. With those signals in place, pipeline value becomes a clearer picture of revenue potential, rather than a hopeful total.

For businesses that also hold stock, an inventory aging report in NetSuite or connected to inventory planning software can expose excess inventory.

Local SEO Lead Quality Reporting by Location

Analytics dashboard showing a city map, service pins, connected icons, and a lead-filtering funnel.

More local search visibility can expand lead generation for home services companies. It can also fill a CRM with names that never book, buy, or fit the service area. Lead quality shows whether each location earns sales-ready opportunities instead of noisy form submissions.

That distinction changes local SEO budget decisions. A home services location with fewer enquiries may still have greater growth potential. It may support better client acquisition than a high-volume branch with missed calls or poor-fit prospects.

Multi-location reporting must connect search results, profile actions, landing pages, calls, CRM records, and closed revenue. For home services teams, this online presence links activity to revenue. Performance then becomes a location decision rather than a ranking debate.

Key Takeaways

  • Define a qualified lead consistently across every location using need, service-area fit, valid contact information, and realistic sales potential.
  • Connect profiles, landing pages, calls, analytics, CRM records, and revenue with one location ID so branch performance can be compared reliably.
  • Use the CRM as the source of truth for qualification, pipeline stages, closed revenue, margin, and loss reasons rather than treating every form or call as a sales opportunity.
  • Compare conversion rates, revenue per lead, pipeline velocity, and sales-cycle cohorts instead of relying on rankings, traffic, or total enquiry volume alone.
  • Use lead quality and operational evidence to decide whether each location needs more demand, better conversion paths, faster follow-up, or tighter targeting.

Measure local SEO lead quality beyond lead volume

A form completion, phone call, or direction request shows interest and searcher intent. It does not prove that the person has a real need, fits the service area, and can become a customer.

For useful location-level reporting, every location needs the same definition of a qualified lead. Without it, a home services branch that logs every inquiry can appear stronger. A branch that filters spam, duplicate records, and low-fit requests may seem weaker.

Define a qualified lead before opening a dashboard

Set practical qualification rules with sales and operations teams. For home services, a qualified lead usually has a relevant need, fits the territory, and provides valid contact information. It should also have a realistic path for client acquisition and sales follow-up.

The definition may also include a minimum project value, insurance type, service urgency, or decision-maker status. Use only fields that affect routing or sales follow-up because long forms can create friction without improving lead quality.

A call or direction request can show strong local demand, but it only becomes a qualified opportunity after the team confirms contact, need, and fit.

Apply the same rules across every location

A franchise group should not let each branch invent its own sales stages. A shared local SEO framework makes home services branch comparisons more reliable and clarifies growth potential for investment decisions.

Use standard labels such as new, contacted, qualified, booked, proposal sent, closed won, and closed lost.

Also record a clear loss reason for home services leads. “Outside service area,” “price shopping,” “no response,” and “capacity unavailable” point to different problems. Combined under one vague “lost” label, they hide useful evidence.

Connect local SEO activity to the right location record

Location-level reporting breaks when names and identifiers change between platforms. A Google Business Profile may use one name, the website another, and the CRM a third. Reconcile NAP information across profiles, pages, and local citations, then build one location ID for every record.

An analyst reviews a laptop beside a pinned city map, notebook, and coffee.

Tag every local entry point

Each profile for a home services branch should pass a location code into analytics and the CRM. A home services landing page should use the same code, along with each paid campaign and tracking number. Consistent GBP UTM tagging for multiple locations helps separate website traffic from individual profiles without guesswork.

Audit each location page’s schema markup and location data before reporting its performance. Use home services call tracking to retain the branch code when a caller comes from a profile or landing page. Mobile optimization makes tap-to-call and landing-page events especially important, so tag both consistently. Normalize referral data from local directories before it enters reporting.

Track source, medium, campaign, landing page, location ID, service line, and lead type. Include organic search as a source, then match the same fields to a home services contact or opportunity record in the CRM. A person may call after finding a profile or submit a form after several visits, so reports need room for more than one touchpoint.

Data pointWhere it startsWhere it should appear
Location IDProfile, landing page, call numberCRM lead and opportunity
Lead sourceOrganic search, UTM tag, referral, call trackingCRM source field
Qualification statusSales or reception reviewCRM lifecycle stage
Revenue and marginClosed deal recordLocation performance report

The location ID is the joining key for branch revenue and customer-path analysis. If it disappears between analytics and the CRM, no dashboard can reliably explain branch sales, growth potential, or client acquisition.

Keep analytics events separate from CRM outcomes

GA4 can record actions such as quote submissions, appointment clicks, and tap-to-call events. Technical SEO supports structured page implementation, while the CRM records whether a sales representative reached the caller or closed the work.

Mark only meaningful actions as key events. A GA4 key-event setup guide can help teams distinguish ordinary page engagement from actions that deserve conversion reporting. Then let the CRM remain the source of truth for qualification, pipeline, revenue, and loss reasons.

Attribute calls and forms without overstating SEO results

SEO, paid media, social media, and website activity should feed the same location record for a unified digital marketing view. For home services, this prevents each channel from claiming credit for the same customer without explaining the final revenue outcome.

Understand what attribution can and cannot prove

A customer may discover a business in Maps, read reviews, and return through branded search before calling from a different device. This fragmented journey is common when seeking home services, and no attribution model captures every interaction perfectly.

Still, a documented model is better than assigning every sale to the final click. Google’s attribution documentation explains how Analytics assigns credit to events across touchpoints, but local search rankings alone don’t prove revenue. Use that credit for channel analysis, then use CRM outcomes to judge client acquisition, growth potential, and local business value.

Compare analytics events with CRM records each month. Different totals are normal because analytics counts actions, while the CRM tracks people, duplicates, and qualified opportunities for home services.

Find operational leaks before changing the SEO plan

A location may rank well and still lose demand because calls go unanswered. For home services, calculate human answer rate as answered eligible calls divided by total eligible incoming calls, multiplied by 100.

Review it by location, service line, weekday, and hour. A low contact rate or long first-response time often points to staffing, routing, or ownership problems for home services rather than weak local rankings. Use local SEO call tracking to connect phone enquiries with marketing sources while keeping the business’s core contact details consistent.

Report the local SEO funnel metrics that shape location decisions

A meaningful report moves beyond traffic, rankings, and total enquiries. It compares lead generation and position maps with qualified leads, qualified revenue, and pipeline activity to guide investment choices. That shows where prospects stop moving and what each location produces after first contact.

Compare rates, not only totals

For home services, start with valid leads. Then calculate qualified lead rate, booking rate, proposal-to-sale rate, lead-to-sale rate, revenue per lead, gross margin, and conversion rates by location. Revenue per lead equals closed-won revenue from a defined lead cohort divided by all leads in that cohort.

Cohorts matter because many home services sales cycles extend beyond the month of the first inquiry. A July lead may close in September. Grouping revenue by the month the lead entered the CRM gives each channel and location a more honest comparison.

A rising conversion count is a warning sign if conversion rates fall. Review search terms, searcher intent, offer language, and sales follow-up before adding budget. Check mobile optimization for calls, forms, and appointment actions.

Use pipeline velocity for higher-value services

For businesses with proposals or consultations, including home services providers, calculate expected pipeline velocity:

(Qualified opportunities x average deal size x win rate) / average sales cycle length

For home services teams, this estimates expected revenue per day from qualified pipeline. It does not show cash collected that day, so treat it as a planning measure. It can also show growth potential when qualified opportunities remain strong.

Compare pipeline velocity by location, service line, and lead source. A smaller home services branch may deserve more investment in client acquisition if it closes larger, healthier-margin work in less time.

Use profiles, maps, and reviews to explain the numbers

Local search visibility matters when it creates qualified conversations. Profile actions, position maps, and reputation data help explain why one location converts while another stalls.

A business owner views a tablet beside a storefront with colorful map markers.

Review Google Business Profile actions by branch

Calls, website visits, bookings, and direction requests often occur before a visitor reaches the website. Therefore, profile reporting belongs beside GA4 and CRM data, not in a separate local SEO spreadsheet.

Use Google Business Profile performance reporting to compare those actions across locations. Then check whether the profile category, services, hours, landing page, reviews, and primary conversion path match the branch’s real offer. For home services, compare category and service choices with searcher intent. Test mobile optimization across the landing page and call path.

Diagnose the cause behind weak local conversion

Position maps can show whether a location loses visibility in profitable neighborhoods and reveal visibility gaps. Pair local search rankings with lead outcomes to identify areas with the strongest growth potential. A broad ranking gap may call for stronger local content, while a high-ranking home services branch with poor lead quality may reveal an offer or service-area mismatch.

Keep NAP information accurate across the website, profiles, and local directories. Audit local citations for consistent names, addresses, and phone numbers across a local business’s online presence. For home services, confirm that service-area language matches the branch’s actual coverage.

Competitor backlink analysis can show whether a branch’s backlink profile matches local competitors and its market, while relevant sponsorships, industry associations, and niche directories make link building more useful. For home services, make link building decisions around commercial fit and relevance, not volume.

Add schema markup that matches visible business details, then validate it against profile, page, and directory records. Use a second schema markup audit to catch mismatched hours, addresses, or service areas, but don’t treat either check as proof of rankings, citations, or sales.

Customer reviews also matter because prospects often compare ratings and recent feedback before calling. In home services, review themes can reveal whether poor lead quality reflects expectations, service fit, or follow-up.

Generic cold outreach about technical errors rarely persuades a decision-maker. Evidence-based outreach using a position map, missed-call data, lost reasons, and revenue opportunity supports reputation management and makes the commercial case for client acquisition clearer.

Add GEO and AEO signals without mistaking exposure for revenue

GEO and AEO reporting should support local SEO reports, extending broader search engine optimization measurement without replacing CRM-based local measurement. An AI answer may mention a location or cite a page because it confirms a narrow fact. That mention does not prove a recommendation, referral visit, qualified lead, or sale.

Track AI answer visibility as its own layer

Use a consistent set of local prompts by city, service, and searcher intent, including urgent home services needs. Record whether answers mention the brand, cite a business-owned URL, include local competitors, and point to a current service page.

Review those prompts regularly, then compare trends by location. Look for visibility gaps between AI mentions, citations, organic clicks, and profile actions across branches.

Keep AI citations separate from organic clicks, profile actions, and revenue. Report a connection only when the CRM links AI answers about home services to results.

Publish details that answer local questions clearly

Current service pages should state where the business operates, who home services are for, and how customers can contact the team. Those pages should explain what happens next, while schema markup, or structured data, supports clarity without proving visibility or revenue. Mobile optimization also matters for users arriving through Maps, organic search, or AI-assisted answers.

Digital marketing becomes measurable when every discovery path reaches a responsive team and a credible local offer for home services. Authority-focused link building can support citation context, but it doesn’t guarantee revenue. For a basic event framework, this overview of GA4 events and conversions clarifies the difference between a tracked action and a business result.

Frequently Asked Questions

What is local SEO lead quality?

Local SEO lead quality shows whether search-driven enquiries become qualified opportunities that fit the service area and have a realistic chance of becoming customers. It looks beyond form submissions, calls, and profile actions to include contact, need, sales progress, revenue, and margin.

Which metrics should multi-location businesses report?

Useful metrics include qualified lead rate, booking rate, proposal-to-sale rate, lead-to-sale rate, revenue per lead, gross margin, and conversion rates by location. Businesses with longer sales cycles should also track pipeline velocity and group revenue by the month each lead entered the CRM.

How can businesses compare lead quality across locations?

Apply the same qualification rules, sales stages, location IDs, and loss reasons to every branch. Then compare rates and revenue outcomes by location, service line, and lead source instead of comparing enquiry totals alone.

Why should CRM outcomes be compared with analytics events?

Analytics can record actions such as quote submissions, appointment clicks, and tap-to-call events, but it cannot confirm whether a person is qualified or became a customer. The CRM connects those actions to contact status, opportunity stages, closed revenue, and loss reasons.

How should a business act on weak local SEO lead quality?

First check response performance, service-area targeting, offer language, landing pages, profile data, and lost reasons before changing the SEO plan. A location with strong visibility but poor outcomes may need faster follow-up or better targeting, while a location with healthy conversion and margin may justify additional investment.

Make every location report lead to action

The strongest local SEO lead quality report connects visibility to qualified opportunities, conversion rates, response performance, sales outcomes, and margin. It reveals whether a location needs more demand, better conversion paths, faster follow-up, or tighter targeting.

Use the evidence to guide staffing at home services locations when response times lag. Improve home services landing pages when conversion paths underperform. Update home services profile data, customer reviews, and reputation management when trust signals weaken. Ensure schema markup matches visible business details.

Then direct the home services budget toward relevant local business partnerships and focused link building. Prioritize locations with stronger growth potential and more efficient client acquisition. When rankings, calls, CRM records, and revenue tell different stories, Get In Touch With Us for a practical review of the reporting gap.

MQL vs SQL: A Qualification System for Service Teams

Glowing lead cards pass through a filter beside a dashboard with one highlighted lead and handshake icon.

A marketing-qualified lead can look promising but still waste a salesperson’s time, so qualification protects service-team capacity.

Clear MQL vs SQL definitions help marketing assess fit against an ideal customer profile and interpret lead behavior consistently. They also give sales a fair way to return contacts that need more context, timing, or proof before a conversation.

The goal is a shared system that moves the right contacts through the sales funnel, supports the buyer’s journey, and strengthens sales and marketing alignment.

Key Takeaways

  • An MQL shows sufficient fit and engagement for continued marketing attention, while an SQL has a credible need, service fit, and timing for a sales conversation.
  • Lead scoring should prioritize business fit before activity and use high-intent behaviors, negative scoring, and CRM outcomes to guide qualification.
  • Sales and marketing should agree on handoff criteria, ownership, response times, and rejection reasons inside the CRM.
  • Leads that are not ready for sales should return to a relevant nurturing path rather than being discarded.
  • Measure MQL-to-SQL and downstream conversion rates by channel and service line to connect qualification with qualified pipeline and revenue growth.

MQL vs SQL: The difference in one sentence

An MQL, or marketing-qualified lead, has shown enough fit and interest for marketing to continue targeted engagement. An SQL, or sales-qualified lead, has enough business fit and a plausible need for sales to begin a direct qualification conversation.

A manager and colleague review funnel stages beside a laptop in a modern office.

An MQL meets an engagement threshold

An MQL may match part of your ideal customer profile and a relevant target persona while taking meaningful actions. They may attend a webinar, return to service pages, download a useful guide, or request a case study. At this stage, they generally remain in the top of the funnel and may need lead nurturing.

That interest is useful, but it doesn’t prove a current project exists. A prospect researching SEO services for next year’s budget is still different from one seeking proposals this month. This MQL definition and examples explains why both engagement and fit matter.

An SQL earns a sales conversation

An SQL, or sales-qualified lead, has a plausible need, a relevant service fit, and credible timing. These signals can indicate buying intent and sales readiness as the contact moves toward the bottom of the funnel. Common triggers include requesting pricing, asking for a scope review, booking a consultation, or naming a problem that needs a provider.

An SQL isn’t a guaranteed deal. It is a contact sales can responsibly work because the available evidence supports outreach. The MQL vs SQL decision should guide the next action, not become a label that nobody questions.

Together, these labels represent different stages in the sales funnel. Clear lead qualification makes the next action easier to assign.

Signal areaMQLSQL
Buyer behaviorReads, subscribes, attends, or revisitsRequests a quote, consultation, or proposal
Business contextPartial fit is visibleNeed, fit, and timing are credible
Next stepNurture with relevant proofSales discovery and opportunity review

Build a lead scoring model service teams can trust

Lead scoring turns scattered signals into a repeatable B2B marketing review, prioritizing contacts by position in the sales funnel. It works best when the score reflects how your service business actually wins work, not a generic template copied from a software company.

Professional reviewing abstract lead scores beside a funnel diagram on a laptop and tablet.

Weight fit before activity

Start with fit, then compare each contact with your ideal customer profile. Then weigh lead behavior, giving more credit to actions that show real interest. Early activity at the top of the funnel shouldn’t carry the same weight.

A practical model might include:

  • Company size, location, industry, and service need that match your ideal customer profile.
  • Role relevance to your target persona, plus engagement with high-value pages, such as the pricing page, case studies, implementation details, or booking pages.
  • Form answers that reveal project scope, budget range, urgency, and decision-maker involvement.

Use negative scoring too. Reduce points for student addresses, unsupported locations, job-seeking messages, and repeated low-intent visits. Marketing automation can apply agreed weights consistently, but your customer relationship management data should set the final weights. A 100-point B2B scoring approach can provide a useful starting structure. Validate it against the conversion rate from scored contacts to qualified opportunities.

Let behavior override a borderline score

Scores are helpful until they hide a clear buying signal. A prospect with 58 points who asks for a proposal deserves faster attention because that request shows buying intent. A prospect with 72 points gained through newsletter clicks may not.

Sales and marketing should review a sample of accepted and rejected contacts every month. Compare lead behavior with qualified outcomes, not only form activity, and look for patterns in lost deals. AI enrichment can add company data, but it shouldn’t promote someone to SQL based on an assumption.

A score prioritizes review. A confirmed business need and a willing buyer justify a sales conversation.

Decide when an MQL is ready to become an SQL

The handoff should happen when a marketing-qualified lead can move to sales-qualified lead status based on evidence for direct contact. Lead scoring can support that decision, but a numerical score or isolated action shouldn’t replace judgment or context. Sales and marketing alignment should establish the sales readiness standard: enough context for a useful first conversation.

A calendar booking alone may be enough for some services. Complex B2B work may need more detail before the lead reaches the decision stage.

Watch for high-intent service behaviors

Direct requests reveal the clearest buying intent. Questions about delivery timing, integration requirements, project scope, a proposal, or a product demo show stronger intent. Within the sales funnel, these requests signal movement toward the bottom of the funnel. This lead behavior carries more weight than casual research.

Other useful signals include repeat visits to comparison pages, multiple stakeholders from the same company, and an answer that describes an active business problem. Contacts that show interest but lack timing or context may need lead nurturing. Self-service buyers may research privately for weeks, then arrive ready to buy later in the buyer’s journey. Don’t require a demo request if your audience prefers consultation forms, email, or phone calls.

At the same time, don’t confuse traffic with a qualified opportunity. An email open, a social follow, or a single blog visit rarely justifies immediate outreach.

Use BANT as a discovery guide

The BANT framework, covering Budget, Authority, Need, and Timeline, guides discovery without blocking every handoff. Sales should confirm enough detail to decide whether an opportunity merits a place in the sales process.

For example, a consultancy may ask about project scope, stakeholders, a likely start date, and how the buyer will choose a provider. A broader lead qualification guide can help teams frame these questions without turning discovery into an interrogation.

Make the handoff visible and time-bound

A strong MQL vs SQL process has owners, response expectations, and a documented outcome. Without those rules, marketing sees “sent to sales,” while sales sees an unworked contact in a crowded sales pipeline. The documented sales process should make ownership clear at each stage of the sales funnel.

Put the agreement inside the CRM

Set a service-level agreement for lead qualification that states who owns the lead at each stage. It should include the response window, required context, a sales readiness check, and reason codes for rejected leads.

For instance, sales might accept each new MQL as a sales-qualified lead, reject it, or return it within one business day. Contacts at the bottom of the funnel need the fastest response, so lead scoring thresholds should support the acceptance criteria. Rejections should use clear categories such as wrong market, no active need, duplicate record, insufficient budget, or no response after the agreed contact attempts.

Review the agreement quarterly and after major campaigns, staffing changes, or new service launches. If follow-up slips, find the real cause. The routing rule, marketing automation workflow, on-call schedule, form notification, or campaign promise may be the problem.

Keep gray-area leads in a useful path

A lead that isn’t ready for sales still has value. Return it to a lead nurturing path based on the reason it stalled. Someone without budget may need proof of return on investment. Someone with a distant timeline may need periodic case studies and planning content.

Landbase reports an average MQL-to-SQL conversion rate of 13%, although results vary by industry, offer, price point, and qualification rules. Track the rate by channel and service line rather than chasing a single benchmark.

A rejected lead becomes useful data only when the rejection reason changes marketing’s next move.

Connect attribution to qualified pipeline outcomes

Attribution is a B2B marketing measurement issue across the sales funnel. Raw traffic, lead counts, and inquiry volume can hide qualified outcomes. Digital marketing teams need a shared record across SEO, performance marketing, social media marketing, and website development as buyers touch several channels before raising a hand.

Preserve the first touch and the path

An SEO article may create awareness at the top of the funnel, while a paid search ad captures the eventual consultation. During the buyer’s journey, several touches may precede the conversion, including LinkedIn, branded search, and a revised website form.

Keep original source, recent campaign, and landing pages in the customer relationship management (CRM) record. Record key conversion events, such as a consultation or product demo, separately.

A fixed lead source naming convention prevents free-text entries from breaking reports and keeps source data consistent for each target persona. Marketing automation can synchronize campaign data with CRM records.

For SEO, GEO, and AEO, discovery signals and intent data help explain lead behavior across the path to conversion. They don’t prove purchase intent alone. CRM stages show whether visibility produced a qualified opportunity and support lead qualification.

Report what moves revenue

Track inquiry-to-MQL, MQL-to-SQL, SQL-to-opportunity, proposal-to-sale, and lead-to-sale stages, then calculate the conversion rate for each. Compare the conversion rate by channel or service line, and review overdue leads and loss reasons beside those numbers.

Pipeline velocity adds useful context to the sales pipeline and downstream sales process: (qualified opportunities x average deal size x win rate) / average sales cycle length. It estimates expected daily pipeline value, not cash collected. Pair it with cost per qualified lead tracking to see whether a channel produces affordable opportunities that sales can close, supporting revenue growth.

When website reports, campaign data, and CRM outcomes don’t match, Get In Touch With Us for a practical review of tracking, lead-page structure, and qualification gaps.

Frequently Asked Questions

What is the main difference between an MQL and an SQL?

An MQL has shown meaningful interest and some alignment with the ideal customer profile, but may not have a confirmed project or timeline. An SQL has enough evidence of need, fit, and timing for sales to begin direct qualification.

How should service teams score leads?

Start with company and contact fit, then add weight for behaviors that indicate buying intent, such as pricing requests, scope questions, or consultation bookings. Use negative scoring and validate the model against qualified opportunities and sales outcomes.

When should an MQL become an SQL?

An MQL should become an SQL when the available evidence supports a useful sales conversation, including a plausible need, relevant service fit, and credible timing. A score can support the decision, but it should not replace judgment or clear buying signals.

What should happen when a lead is rejected by sales?

The CRM should record a clear rejection reason, such as no active need, wrong market, insufficient budget, or no response. Marketing can then return the contact to a relevant nurturing path and use the reason to improve targeting, content, or qualification rules.

Which MQL-to-SQL metrics should teams track?

Track inquiry-to-MQL, MQL-to-SQL, SQL-to-opportunity, proposal-to-sale, and lead-to-sale conversion rates. Compare these metrics by channel and service line, while also reviewing response times, overdue leads, and loss reasons.

Build trust through better qualification

The best MQL vs SQL process gives marketing a clear target and sales fewer dead-end conversations. It also protects promising prospects from rushed outreach when they need more information first.

Use fit, intent, response speed, and CRM outcomes to refine the sales process. A shared standard strengthens sales and marketing alignment, supporting revenue growth and a healthier sales pipeline.

Local SEO Entity Consistency Audit: Find and Fix Real Gaps

Connected map pins and directory panels form one unified business profile.

A customer who finds two phone numbers for your business may call neither. When local search results, directory profiles, and location pages disagree, the buyer has to decide which source to trust.

A local SEO audit catches those conflicts before they cost calls, bookings, and search visibility. It gives search engines one clear version of your business, but doesn’t guarantee rankings. Start by defining that version, then compare it everywhere customers and search systems may find it.

Key Takeaways

  • Create one canonical business record covering the real business name, address, phone number, website URL, hours, categories, and service areas.
  • Audit Google Business Profile, maps, directories, social profiles, aggregators, and location pages for conflicting details, duplicates, outdated records, and ownership issues.
  • Fix customer-facing errors first, especially incorrect names, addresses, phone numbers, map pins, broken links, and duplicate or closed-location pages.
  • Match directory data with strong website evidence, including distinct location pages, accurate contact details, useful local content, internal links, and correct indexing signals.
  • Treat entity consistency as an ongoing process, measure calls and qualified leads after corrections, and remember that accurate data supports search understanding without guaranteeing rankings.

Why a local SEO audit starts with entity consistency

Directories and local citations are not separate marketing chores. Together, they form the public record of your business, including who you are, where you operate, and how customers can contact you.

Relevance needs clear business facts

Google explains that local results depend mainly on relevance, distance, and prominence. These are Google’s core local ranking factors. Consistent listings support relevance because your business category, services, address, and website all point to the same entity.

Accuracy will not move a business closer to a searcher, but clearer entity signals may support local rankings. Not every mismatch is evidence of Google penalties. Accurate data removes preventable confusion when Google compares your profile with your website and third-party sources. Prominence depends partly on your backlink profile and reviews; citation consistency complements, rather than replaces, link and reputation work.

A business called “Horizon Plumbing” should use that real public-facing name everywhere. Adding city names or extra services to only one profile creates a mismatch and can cause profile edits to be rejected or reversed.

Inconsistent listings lose customers before rankings

A wrong opening hour can send a customer to a locked door. An old tracking number can route calls to an unused line. A duplicate page can split reviews and hide the profile that has the strongest history.

These problems also blur reporting. If a customer arrives through a listing with the wrong URL, you cannot accurately connect that visit to a call, form submission, or qualified opportunity.

Build one canonical business record first

Editing listings before agreeing on the correct facts creates fresh errors. Create a master record that every team member, franchise manager, or agency can access. This record becomes the audit template for future reviews and listing updates.

Define the fields every directory must match

Use the legal or customer-facing business name that appears on signage, invoices, and the website. Then document formatting choices, such as “Suite 210” versus “#210”, so teams don’t create accidental variations.

FieldCanonical decision
Business nameUse the real public-facing name without added keywords.
AddressRecord the exact format, suite number, and map pin.
Phone numberSet one primary local number for public listings.
Website URLSelect the preferred location or contact-page URL.
HoursInclude regular and holiday-hour ownership.
CategoriesSet the primary business category and approved secondary categories.
Service areaList real service areas without inventing office locations.

Keep a notes column for exceptions, including legitimate differences when normalizing local citations with the master data. For example, a business may use a call-tracking number in paid ads but retain its canonical number in public directory profiles.

A specialist compares business details across directory cards on a desk.

Separate storefront rules from service-area rules

A physical location needs a correct customer-facing address, map pin, entrance details, and hours. A service-area business needs consistent service geography and must avoid leaving old home or office addresses scattered across profiles.

Review Google Business Profile and its Google Maps result, along with Bing Places, Apple Maps, Yelp, industry directories, social profiles, and data aggregators based on where customers search. A comparison of Google, Yelp, and Apple Maps can help teams decide which platforms deserve first attention in their market.

Apple Maps deserves a direct review, particularly where customers use iPhones for directions and voice search. An Apple Business Connect overview can help marketing teams include Apple data in their directory process.

Find duplicate listings and fix the highest-risk errors

Treat the local SEO audit as a research task before it becomes an editing task. Search each platform for the exact business name, previous names, former phone numbers, old web domains, and address variants to uncover duplicate listings. Use a brief competitor analysis to spot naming, category, and location patterns. Keep this step focused on research, not a separate competitive SEO project.

Look beyond obvious name duplicates

A duplicate does not always use the same business name. One listing may have a former suite number, a shortened DBA name, or an old employee’s phone number. Multi-location companies often find one branch attached to another branch’s category, website, or reviews.

Populate the audit template with each listing’s URL, ownership status, error source, current status, and next action. Mark each profile as canonical, needs editing, duplicate, closed, or unclaimed. This makes handoffs far safer than a loose collection of screenshots.

Correct records in order of customer harm

Prioritize corrections by the damage they can cause:

  1. Fix wrong names, addresses, phone numbers, map pins, and broken website links first.
  2. Resolve duplicate or closed-location pages that could divide calls, reviews, or directions.
  3. Update hours, categories, services, photos, and attributes after core identity details match.

For suspected fake online reviews, preserve screenshots, the displayed star rating, and relevant details. Then report them through the platform’s review process. Do not reply with personal customer information or public accusations. Meanwhile, keep requesting genuine feedback from real customers as part of review management. One disputed review should not stop normal reputation work.

An inaccurate or disputed record isn’t automatically proof of Google penalties, so assess the evidence before drawing conclusions.

For larger cleanup projects, a structured process for local citations and NAP consistency helps teams track ownership, status, and verification dates.

A directory correction is incomplete until the live listing, search result, and customer path all reflect the new information.

Match directory data with website evidence

Your website is the strongest place to explain a business location, service area, and next step. Yet many companies let its contact details drift from directory records after a redesign, relocation, or call-tracking change.

Give every location page distinct proof

Treat each location page as a distinct local landing page. Show the matching name, phone number, address or service area, relevant hours, and a clear way to contact the right branch. Use local keywords only when they accurately describe the branch’s real service geography, and add proof such as project photos, customer feedback, team details, or service-area information. Together, these details provide practical on-page SEO evidence for users and search systems.

Avoid cloning a city page and swapping place names. Thin near-duplicates create weak pages for users and may leave search systems unsure which page represents each branch. Schema markup is structured data that can clarify visible business details, but it cannot compensate for inaccurate content or guarantee a rich result.

Check indexing, canonicals, and internal links

Open Google Search Console’s Pages report and inspect important service and location URLs. Use technical SEO checks to review crawlability, internal links, canonical URLs, and noindex directives. A page that is crawled but not indexed may need stronger content, better internal links, or a clearer canonical signal.

Also check that lead pages return a 200 status, aren’t blocked by noindex, and use the intended canonical URL. Keep thank-you pages, login screens, and parameter pages out of the index when they have no search value. An indexing issue isn’t automatically evidence of Google penalties, so verify these technical signals first. A lead-generation SEO audit checklist can help connect those checks to conversion-focused location pages.

Turn the audit into an operating process

Business data changes often. New branches open, teams move, phone providers change, and holiday hours arrive. A one-time cleanup becomes outdated unless someone owns the process. Regular ownership checks distinguish ordinary profile drift from a genuine search issue, rather than assuming Google penalties caused every change.

Assign owners and use the right tools

For a single location, a shared spreadsheet may be enough. Use a standardized audit template for the platform, listing URL, owner account, canonical fields, issue type, action date, and verification date.

For multi-location brands, BrightLocal, Semrush, and Whitespark can speed up discovery and monitoring. A rank tracking tool and citation tracker can support ongoing checks, alongside a direct review of Google Business Profile. Still, a tool cannot tell whether a small address difference is harmless formatting or a sign that two separate entities have been mixed together.

City map connecting three storefront locations with directory cards and laptop charts.

Include GEO and AEO in the review

Generative and answer-focused search experiences can repeat incorrect business facts when sources conflict. That makes entity consistency useful for GEO and AEO, as well as classic map rankings. Consistent source data and structured data can support machine understanding, but they don’t guarantee recommendations or leads.

Track a fixed set of high-intent local prompts each month. Log the answer, named business, cited URL, location, date, and whether the result gives a recommendation or only confirms a fact. A citation can support one detail, such as hours, without generating a visit or lead.

If AI visibility appears in Search Console for your property, treat impressions as an exposure signal. Pair them with referral traffic, qualified enquiries, and closed revenue before making budget decisions.

Measure results after corrections go live

Start a local SEO audit with a baseline before making changes. Track local pack ranking by location, profile actions, calls, website clicks, and organic traffic. Also monitor direction requests, review trends, indexed location pages, and qualified leads.

Average position alone can mislead because local rankings vary across devices, locations, and result layouts. Compare clicks, impressions, click-through rate, and conversion outcomes before deciding whether a correction improved performance.

Entity accuracy should connect SEO with broader Digital Marketing work. Compare local performance with your site’s backlink profile for broader SEO context, not as a substitute for correcting entity inconsistencies. Performance Marketing ads should point to a relevant landing page whose contact details and offer match the directory profile. Social Media Marketing bios need the same contact route, while Website Development teams must protect core business details during redesigns. If your listings, local pages, and lead data conflict, Get In Touch With Us for a practical review of the gaps.

Frequently Asked Questions

What is a local SEO audit?

A local SEO audit is a structured review of how consistently a business appears across search results, maps, directories, social profiles, and its website. It identifies conflicting details, duplicate listings, technical issues, and gaps that may confuse customers or search systems.

Which business details should match across listings?

The core details include the public-facing business name, address, phone number, website URL, hours, categories, and service area. Formatting differences can be documented as exceptions, but the underlying business facts should remain accurate and consistent.

What should be fixed first during a local SEO audit?

Correct wrong names, addresses, phone numbers, map pins, and broken website links before updating secondary profile details. Then resolve duplicate or closed-location pages that could divide reviews, calls, or directions.

Does consistent local SEO data guarantee higher rankings?

No. Consistent entity data reduces avoidable confusion and supports clearer relevance signals, but it does not guarantee rankings, recommendations, or leads. Local visibility also depends on factors such as distance, prominence, reviews, links, and the quality of the customer experience.

How often should a local SEO audit be performed?

Review business data whenever a location, phone provider, website, team, or operating hours change, and schedule regular checks for ongoing profile drift. Multi-location businesses should assign owners and record verification dates so corrections remain current.

Keep the business record trustworthy

A local SEO audit is not a directory submission exercise. It is a repeatable check that your business presents one recognizable identity wherever customers, maps, and answer engines find it.

Start with a canonical record, correct customer-facing errors first, and verify the website evidence behind every profile. Consistent entity data reduces confusion for search systems and customers, without guaranteeing a ranking outcome.

Google Ads Conversion Actions: Primary vs Secondary

Dashboard showing a gold primary conversion path and blue supporting conversion signals.

Your campaigns can produce cheap form fills while sales conversations stay sparse. These actions decide which visitor behaviors count as success and which signals automated bidding can pursue.

A form start, brochure download, phone call, and sales-qualified lead don’t carry the same business value. If the setup treats them as equal, it will optimize for activity rather than genuine buying intent.

The right primary and secondary setup gives your bidding strategy a clearer destination.

Key Takeaways

  • Primary conversions appear in the Conversions column and can guide smart bidding when they belong to the campaign’s active goal. Use them for verified lead outcomes that reflect the sales result you want more of.
  • Secondary conversions appear in All conversions and support observation, troubleshooting, and funnel analysis. They can influence bidding only when included in a custom goal.
  • Raw form submissions, CTA clicks, form starts, downloads, and short calls are often better treated as supporting signals until their quality is proven. Promote qualified CRM stages, booked consultations, or meaningful calls when the data is dependable.
  • Configure Google Tag Manager to fire conversion tags only after a confirmed success event, and use Conversion Linker, consent mode, enhanced conversions, and stable lead identifiers carefully.
  • Connect Google Ads with CRM outcomes through offline conversion imports, while using GA4 for journey analysis and validation rather than automatically making it the bidding source.

How Google Ads conversion actions steer lead-gen bidding

A conversion action measures one defined behavior, such as a submitted enquiry form, booked consultation, website call, or imported qualified lead. Each action has a distinct conversion action type and belongs to one or more conversion goals. For website data, a Google tag connects the event with conversion reporting. The conversion category is an action-setting choice, not proof of lead quality.

Website, phone, imported, app, and impression-based events need different quality checks under that conversion action type. App conversions and view-through conversions shouldn’t automatically be treated as qualified leads.

Primary conversions appear in the Conversions column and can guide smart bidding when they belong to the campaign’s active goal. Secondary conversions appear in All conversions and support observation. Google’s primary and secondary conversion action guidance confirms one practical exception: a secondary action can influence bidding when it sits inside custom goals.

A marketer reviews campaign charts on a laptop beside a notebook and coffee.

Account-default goals apply primary actions across campaigns unless you set campaign-specific goals or use custom goals. Therefore, changing a conversion action can affect far more than one campaign. The Google Ads API can expose action status and goal configuration for teams auditing accounts programmatically.

SettingWhere it appearsBest use for lead generation
PrimaryConversions and All conversionsA verified lead outcome that you want smart bidding to increase
SecondaryAll conversionsSupporting signals, early funnel actions, and quality checks
Custom goalDepends on the selected actionsA campaign where custom goals define a distinct optimization target

Treat every primary action as an instruction to the algorithm. A poorly chosen action can increase lead volume while lowering lead quality, especially when campaign-specific optimization relies on custom goals.

Choose primary signals based on sales quality

Start with your sales team’s definition of a worthwhile enquiry. Conversion tracking records an event, but it doesn’t prove a real sales outcome.

Raw lead submissions are useful, but imperfect

A confirmed form submission is often the first measurable lead event, but its conversion action type doesn’t make it valuable by itself. It can include spam, duplicate requests, existing customers, job applicants, or people outside your service area.

Keep form starts, CTA clicks, pricing-page visits, and downloadable resources as secondary conversions. They help diagnose landing-page behavior without pushing the bidding system toward shallow engagement.

At launch, a raw lead submission may need to remain the bidding goal because qualified lead feedback is too slow or sparse. In that situation, check recent CRM records often. Add spam controls and review whether tags fire only after a successful server-confirmed submission.

Promote qualified leads when your CRM data is dependable

A sales-qualified lead should meet criteria your business can defend, such as a relevant service need, workable budget, serviceable location, and valid contact details. A booked consultation may be a stronger bidding goal for some businesses. Others should wait for sales acceptance.

Once the CRM returns that status consistently, use offline conversions to import it. Make that qualified stage the core bidding signal for the relevant campaign, with a conversion action type that matches it. Avoid putting a raw form fill and its later qualified version in the same bidding goal unless you have deliberately set values and understand the duplicate optimization signal.

Where opportunity values differ, import a reasonable dynamic conversion value at the qualified opportunity or closed-sale stage. The Google Ads API can upload or manage these qualified CRM outcomes. Also retain a stable lead ID, or use transaction IDs, to prevent repeated submissions from inflating results. Your cost per qualified lead tracking should reflect these CRM outcomes, not only the cheapest enquiries.

Set up lead conversion actions in Google Tag Manager

A well-chosen goal still fails when Google Tag Manager lets the Google tag fire on a button click instead of a completed lead event. Conversion tracking should follow a confirmed success state, so build the path around that outcome.

Laptop and phone showing connected website, ad, and CRM workflow panels.

Install tags around the confirmed lead event

  1. In Google Ads, go to Goals, open Conversions, select Summary, and create a website conversion action.

Choose the appropriate conversion action type for the completed form event. It should record website conversions only after the form succeeds. 2. In Google Tag Manager, place the Google tag across the site. Install Conversion Linker across the landing-page domain, then set Conversion Linker to fire before the conversion tag.

Keep the Google tag in the same container as the conversion setup. 3. Create a Google Ads conversion tracking tag in Google Tag Manager. Configure the Google tag to fire only when the form submission succeeds.

An event snippet should follow successful server validation or a confirmed data layer event. A unique thank-you page can also work if no other action reaches it. 4. Use Preview mode in Google Tag Manager to test one real submission. Confirm Conversion Linker fires once, then check conversion tracking.

Verify the Google tag, conversion ID, label, trigger, consent mode behavior, and count setting before publishing. For advanced QA, use the Google Ads API to compare IDs, labels, and action status.

Also check Conversion Linker domain coverage. Remove duplicate containers that could fire a second Conversion Linker.

For most lead forms, choose a count of “One” unless repeat submissions after the same ad interaction carry separate commercial value.

Add enhanced conversions for leads with consent

Enhanced conversions for leads connect consented first-party details, such as an email address or phone number, with later CRM outcomes. This user-provided data may be hashed for matching, which can improve attribution when cookies or click identifiers are incomplete.

Accept the Customer Data Terms, choose the lead data source, and configure the data in Google Tag Manager. Set the Google tag to respect consent mode, then test the Google tag before publishing.

Check that Conversion Linker remains compatible with this enhanced lead-matching setup. Consent requirements should be part of the implementation, not an afterthought.

Google’s enhanced conversions for leads checklist covers the required implementation checks.

This setup doesn’t replace careful data handling. Collect only information you have permission to use, document consent, and secure the path between the form, CRM, and upload process.

If match rates or diagnostics look wrong, inspect the Google tag and Conversion Linker first. Review the Conversion Linker settings in Google Tag Manager, and check consent mode in diagnostics before changing bid targets. Use this enhanced conversions diagnostic guide when the setup still reports errors.

Connect Google Ads to the CRM outcome

Lead generation attribution doesn’t end when someone submits a form. The downstream CRM record shows whether the lead became a real opportunity.

Form capture handles data collection, the CRM preserves the outcome, and Google Ads uses the selected signal for bidding. Keep those jobs separate when reviewing performance.

Preserve identifiers at the moment of capture

Good conversion tracking starts at form capture. Store the original click identifier, landing page, timestamp, campaign data, consent status, and lead ID with the CRM contact. For Google Ads, retain GCLID when available, plus WBRAID or GBRAID where applicable.

Record whether consent mode affected the tag and later attribution. Keep the Google tag tied to the same lead record, so identifier persistence survives CRM processing. Conversion Linker can help retain click identifiers across the landing page and form flow.

Use hidden fields in lead forms and verify that your CRM integration doesn’t overwrite them during deduplication. Include transaction IDs when your setup supports them. Check the container in Google Tag Manager, then test a fresh submission in Google Tag Manager before launch.

This guide to capturing GCLID and WBRAID can help teams keep the identifiers needed for lead attribution.

Google Ads can match offline conversions from CRM stages back to ad interactions through its offline conversion import process. Use offline conversions when the CRM stage, rather than the form submission, is the outcome you want to measure.

For enhanced conversions, upload outcomes within 63 days of the associated last ad click. Treat that limit as the conversion window for the import. Teams can also use the Google Ads API to validate upload status programmatically.

If duplicate records appear, inspect Conversion Linker and the Google tag before changing CRM rules.

Give native Google Ads and GA4 different jobs

Native Google Ads conversions give you direct control over bidding goals and conversion goals. They’re usually the clearest choice for the immediate submitted-form or website-call event.

Google Analytics is better suited to broader journey analysis. It can show how content, organic visits, and assisted paths contribute before the enquiry. Review those paths in the GA4 property, and interpret assisted paths and view-through conversions through the chosen attribution model.

Use Google Analytics for journey context, not direct bidding control. If you import an event from the GA4 property into Google Ads, it becomes a Google Ads conversion action. Configure its conversion action type intentionally, and document the GA4 property as the data source.

Set campaign goals around that one source. Campaigns using custom goals can intentionally use a different action set, but document why.

Don’t count the same successful form through a native Google tag and an imported Google Analytics event as separate bidding signals. Choose one source for bidding and use the other for validation.

Use conversion tracking reports to check source deduplication between the native tag and imported event. Compare the GA4 property with Google Analytics reports to validate duplicates between sources. Validate the Google tag against the GA4 property event before changing bids.

Audit calls and reports before changing bids

Phone leads need their own conversion tracking design because not every call reflects buying intent. Modeled or incomplete call data may reflect consent mode settings, so audit it before adjusting bids.

Separate website calls from calls placed from ads

Treat phone call conversions from ads separately from calls generated by your website. Website call tracking uses Google Tag Manager to deploy a Google tag for number replacement. Configure the Google tag to fire after a minimum call duration, then test the Google tag during QA.

Set the duration from your own call data. Review recordings or CRM dispositions to confirm that the conversion action type reflects meaningful calls, not short, low-value ones.

Google’s website call tracking instructions explain the technical requirements. Keep short calls as non-bidding signals until the duration threshold reliably reflects a meaningful conversation. If your CRM records sales calls, importing qualified calls as offline conversions later gives you greater control.

Compare Conversions with All conversions

In campaign reporting, segment performance by conversion action to see which events drive the total. Identify the data source first: native Google Ads, imported analytics, or CRM data. Teams needing action-level segmentation can use the Google Ads API.

Compare the Conversions column with All conversions before raising budgets or changing target CPA. Check whether custom goals or campaign-specific settings alter the reported total.

View-through conversions represent users who saw an ad and converted later without clicking. Segment view-through conversions by network or campaign. Don’t treat view-through conversions as direct qualified leads by default. Compare view-through conversions separately before changing target CPA.

Separate app conversions from website calls when reviewing lead-gen totals. Keep app conversions in a separate scope so app events don’t inflate lead-gen reporting.

A rising conversion count is a warning sign when the CRM’s qualified lead rate falls.

SEO, performance marketing, social media marketing, and website development teams should use the same lead definitions, even when their attribution models differ. Google Analytics may show assisted interactions in broader digital marketing reports. AEO and GEO content may influence an enquiry, but the CRM remains the bidding source of truth for qualified pipeline.

Frequently Asked Questions

What is the difference between primary and secondary conversion actions?

Primary conversions appear in the Conversions column and can guide smart bidding when they belong to the campaign’s active goal. Secondary conversions appear in All conversions and are generally used for observation, analysis, and quality checks.

Should form submissions be primary conversions?

A completed form can be a primary conversion when it is the best available indicator of lead intent. However, spam, duplicates, existing customers, and poor-fit enquiries can reduce its value, so qualified CRM stages may be a stronger bidding signal once reliable data is available.

How should qualified leads be imported into Google Ads?

Import the qualified CRM stage as an offline conversion and use it as the core bidding signal for the relevant campaign. Preserve a stable lead ID or transaction ID, and upload dynamic values when opportunity quality differs.

When should a Google Ads conversion tag fire in Google Tag Manager?

The tag should fire only after the form or other lead event reaches a confirmed success state, such as server validation, a confirmed data layer event, or a unique thank-you page. Test the Google tag, Conversion Linker, trigger, consent behavior, and conversion settings before publishing.

Should GA4 and native Google Ads conversions both guide bidding?

Choose one source for bidding so the same successful action is not counted as two optimization signals. GA4 is useful for broader journey analysis and validation, while native Google Ads conversions often provide clearer control over bidding goals.

Build bidding around the lead you want more of

Google Ads conversion actions guide smart bidding. Primary conversions should resemble the sales outcome your team wants to create more often, not merely the easiest website interaction to record.

Use secondary actions to inspect intent, troubleshoot tracking, and compare funnel quality. Google Analytics can validate the journey, but it shouldn’t automatically become the bidding source. If the account includes app conversions, review custom goals for each campaign before judging performance.

Before trusting a low cost per lead, audit Google Tag Manager and confirm your Google tag fires correctly. Then connect Google Ads data to disciplined CRM qualification.

If your conversion columns and CRM outcomes tell different stories, Get In Touch With Us for a practical review of tracking, lead quality, and campaign goals.